 4
4peptides
spectra
0.000 | 0.000
0.205 | 0.274
0.000 | 0.018
0.000 | 0.000
0.000 | 0.000
0.336 | 0.395
0.360 | 0.404
0.000 | 0.000
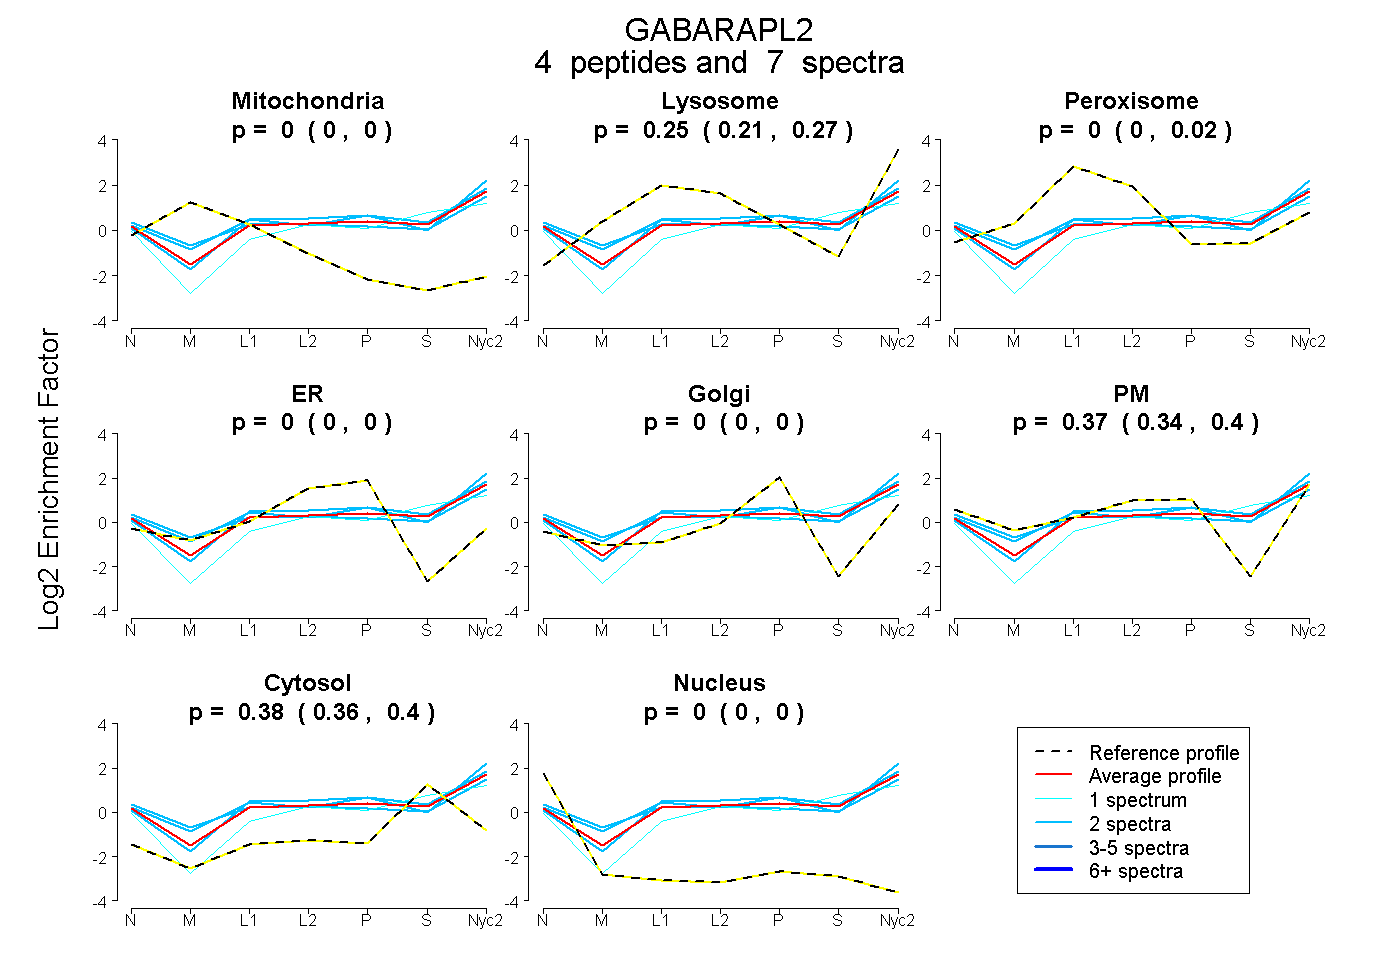
| Plot | Mito | Lyso | Perox | ER | Golgi | PM | Cytosol | Nucleus | |||||
| Expt A |
4 peptides |
7 spectra |
|
0.000 0.000 | 0.000 |
0.246 0.205 | 0.274 |
0.000 0.000 | 0.018 |
0.000 0.000 | 0.000 |
0.000 0.000 | 0.000 |
0.370 0.336 | 0.395 |
0.384 0.360 | 0.404 |
0.000 0.000 | 0.000 |
| 1 spectrum, VPVIVEK | 0.000 | 0.130 | 0.000 | 0.000 | 0.000 | 0.291 | 0.579 | 0.000 | ||
| 2 spectra, TVPQSSLTMGQLYEK | 0.000 | 0.160 | 0.100 | 0.000 | 0.000 | 0.416 | 0.324 | 0.000 | ||
| 2 spectra, EDHSLEHR | 0.000 | 0.299 | 0.000 | 0.000 | 0.000 | 0.340 | 0.361 | 0.000 | ||
| 2 spectra, AIFLFVGK | 0.000 | 0.328 | 0.000 | 0.000 | 0.000 | 0.396 | 0.276 | 0.000 |
| Plot | Mito | Lyso or Perox | ER | Golgi | PM | Cytosol | Nucleus | ||||||
| Expt B |
2 peptides |
6 spectra |
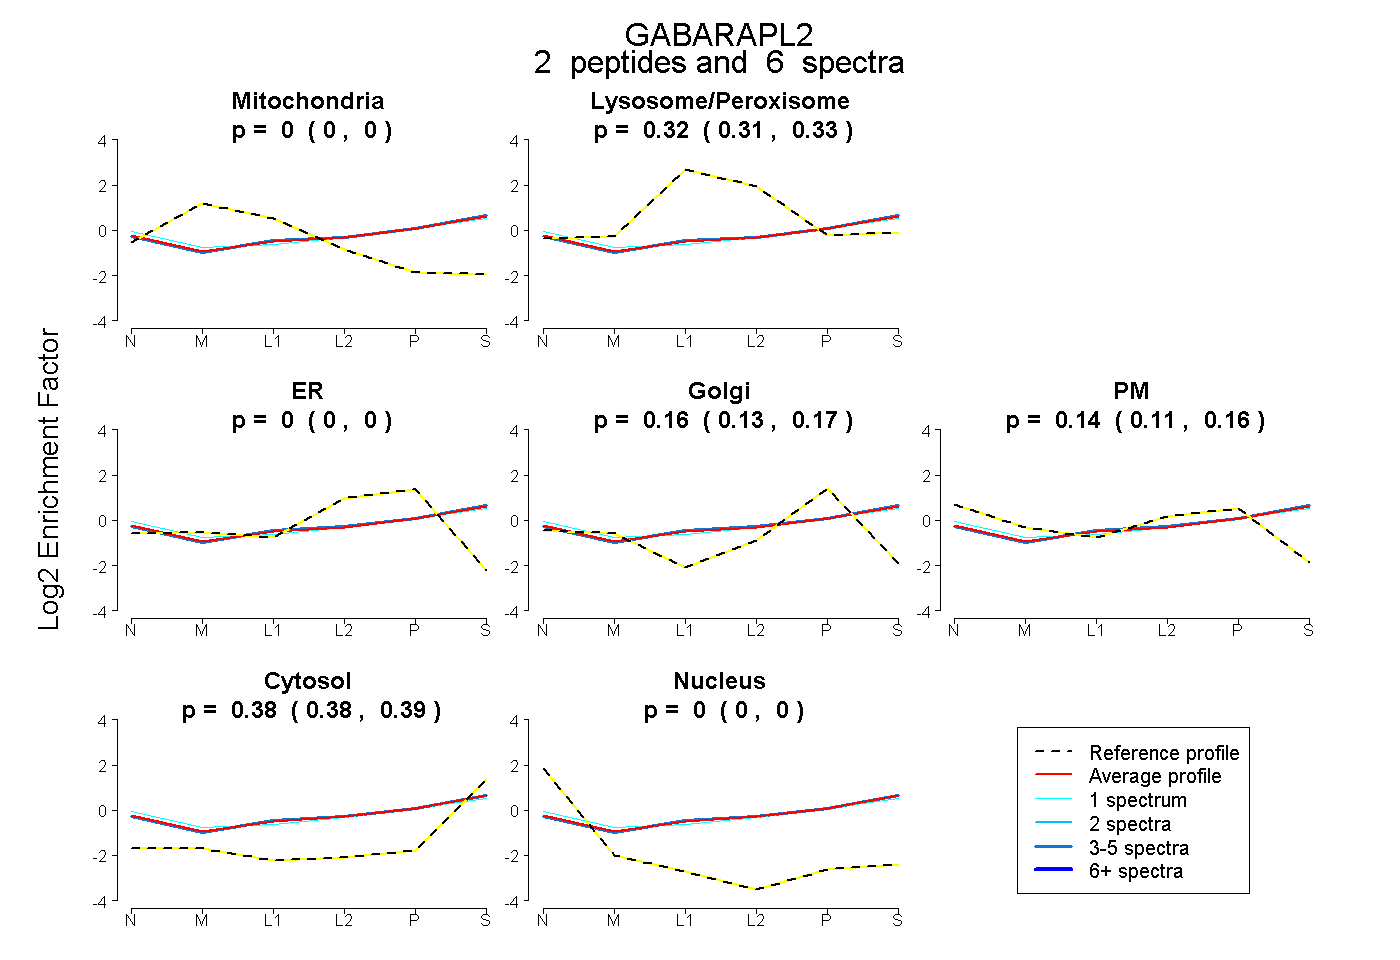 |
0.000 0.000 | 0.000 |
0.323 0.314 | 0.332 |
0.000 0.000 | 0.000 |
0.155 0.135 | 0.172 |
0.137 0.110 | 0.160 |
0.384 0.378 | 0.390 |
0.000 0.000 | 0.000 |
|||
| Plot | Lyso | Other | |||||||||||
| Expt C |
4 peptides |
15 spectra |
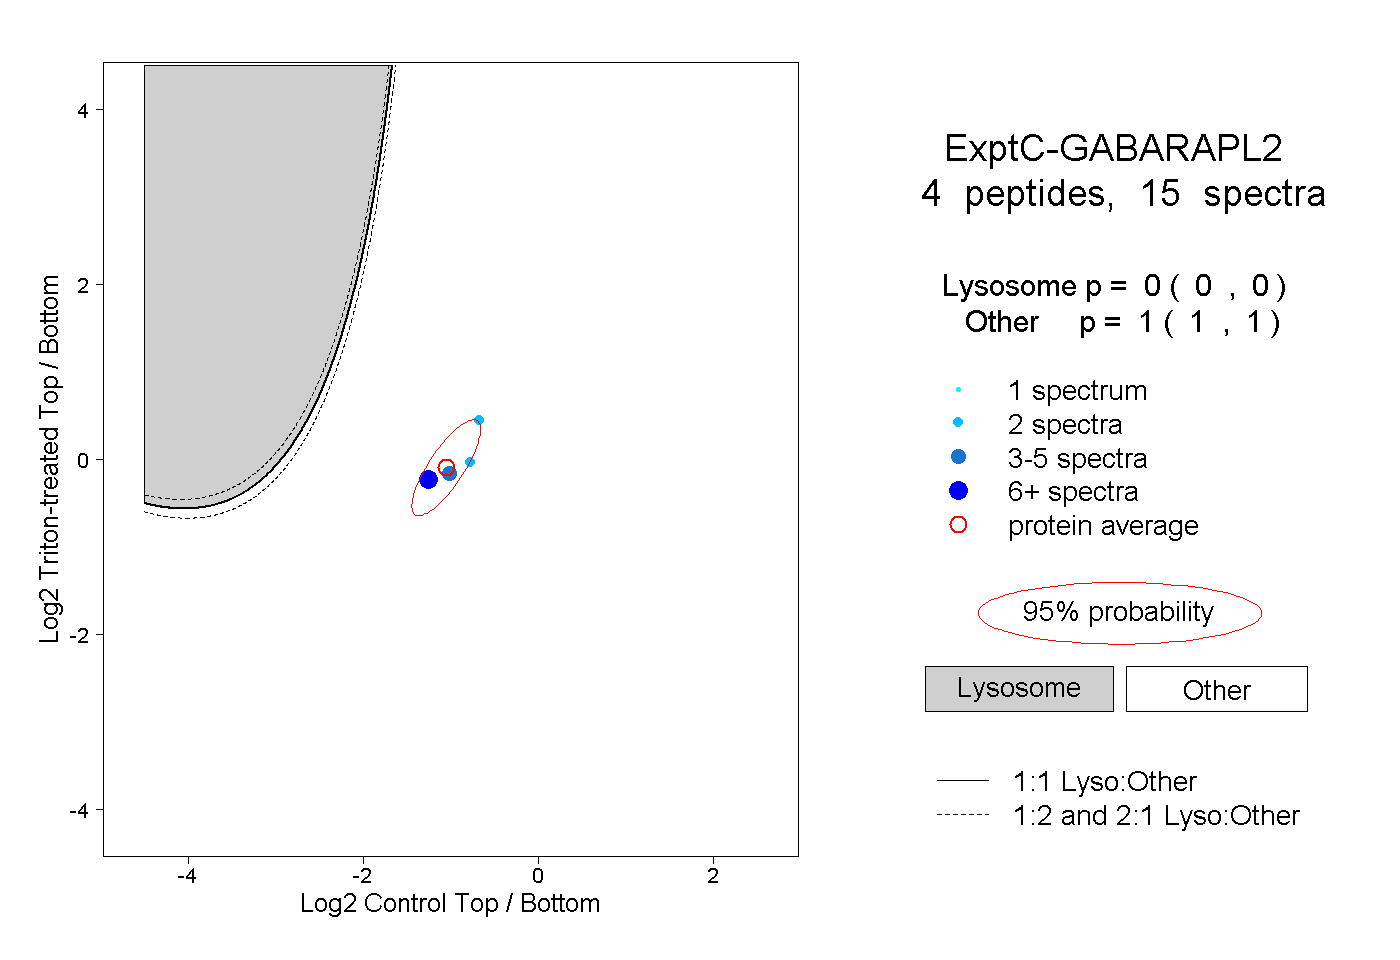 |
0.000 0.000 | 0.000 |
1.000 1.000 | 1.000 |