 9
9peptides
spectra
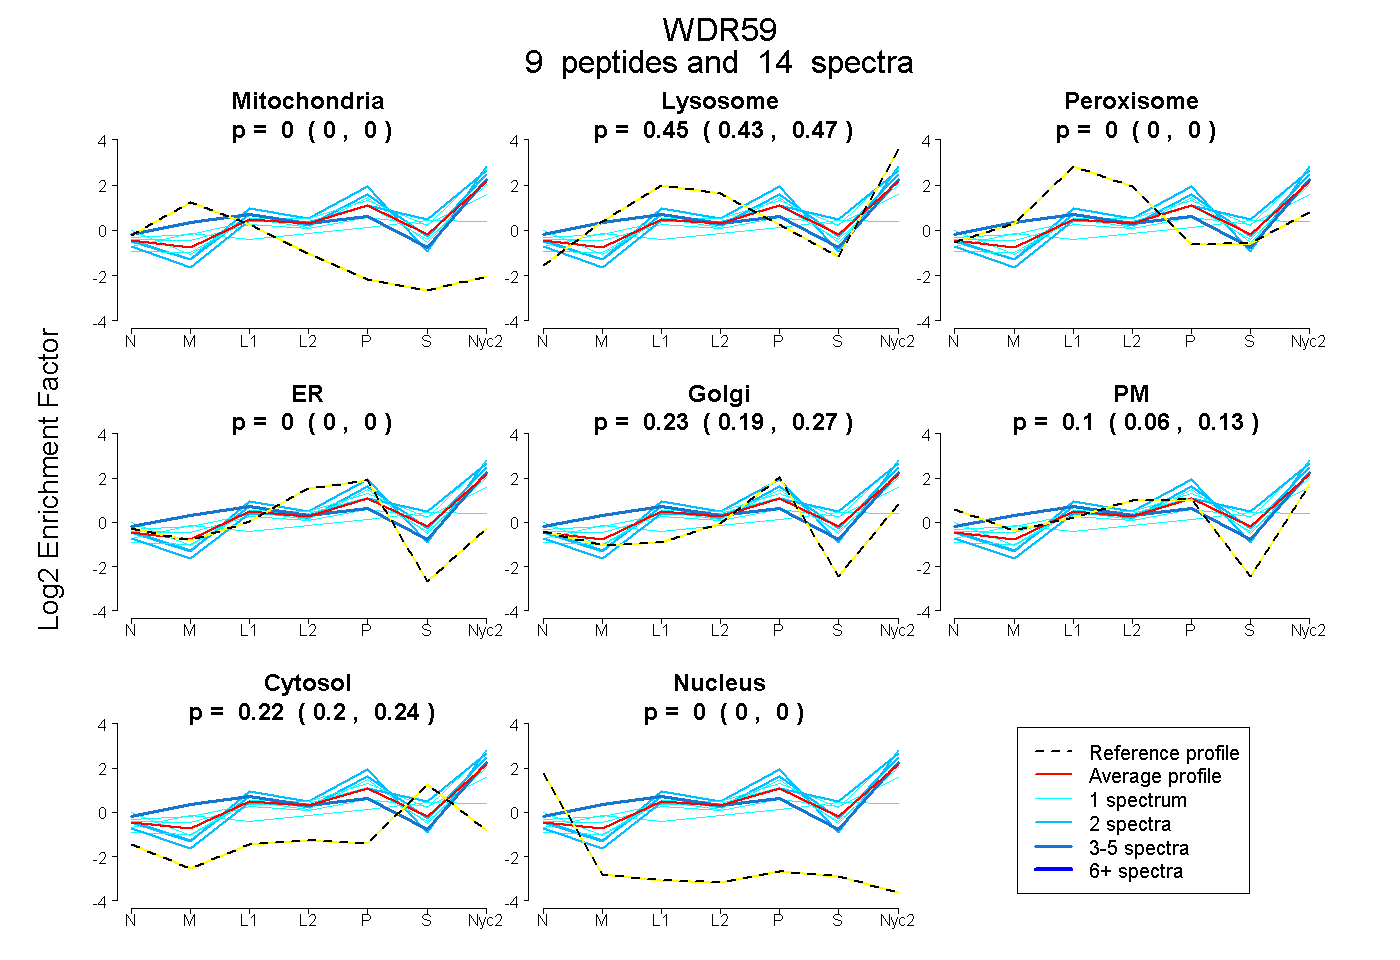
0.000 | 0.000
0.429 | 0.469
0.000 | 0.000
0.000 | 0.000
0.190 | 0.268
0.056 | 0.129
0.201 | 0.236
0.000 | 0.000
9peptides
spectra
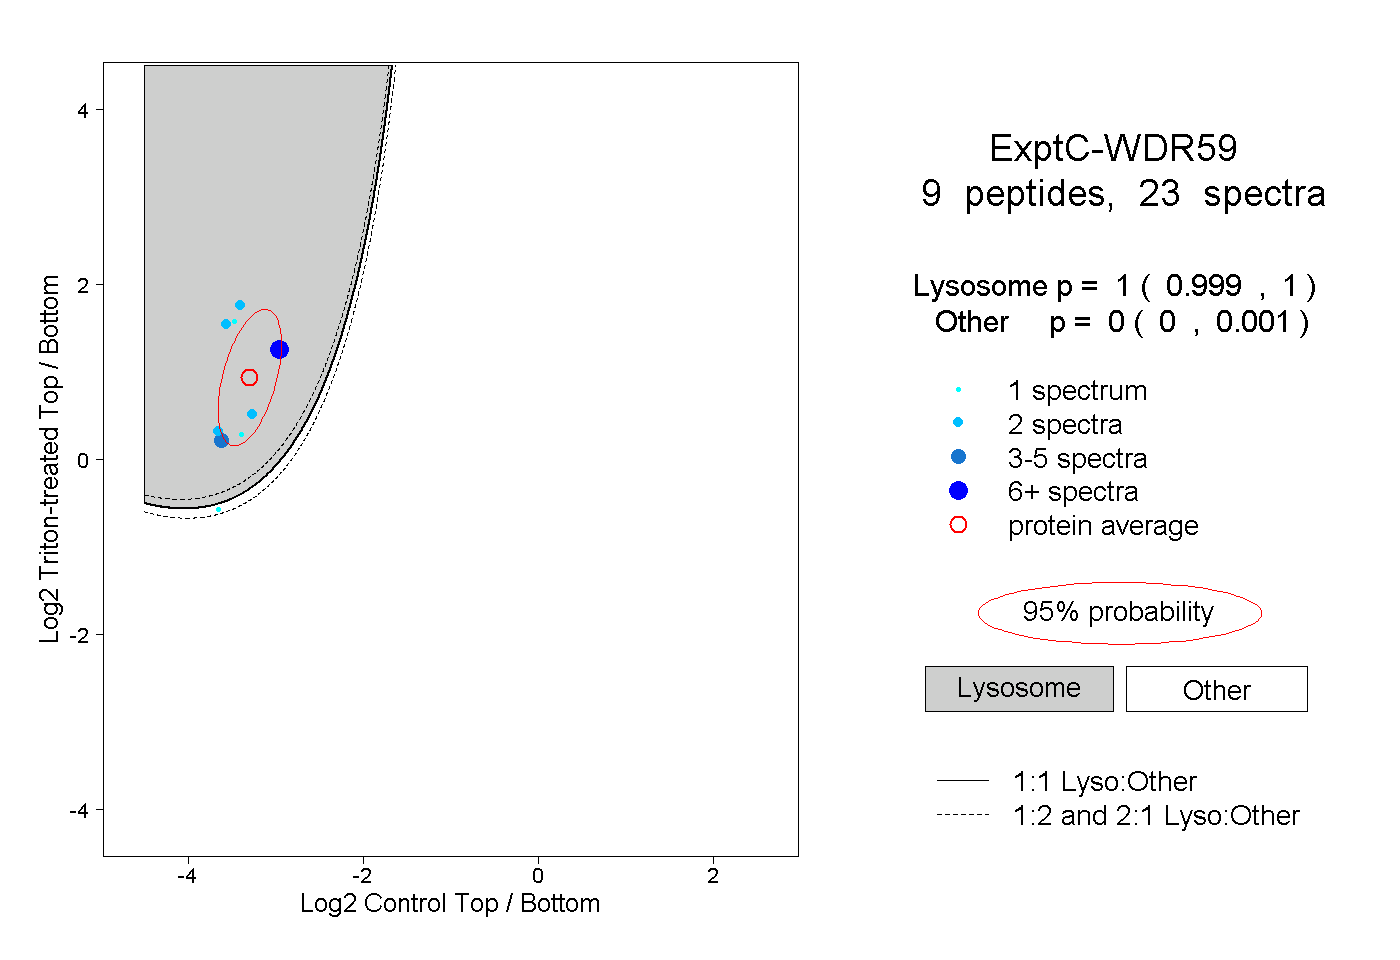
0.999 | 1.000
0.000 | 0.001
2peptides
spectra
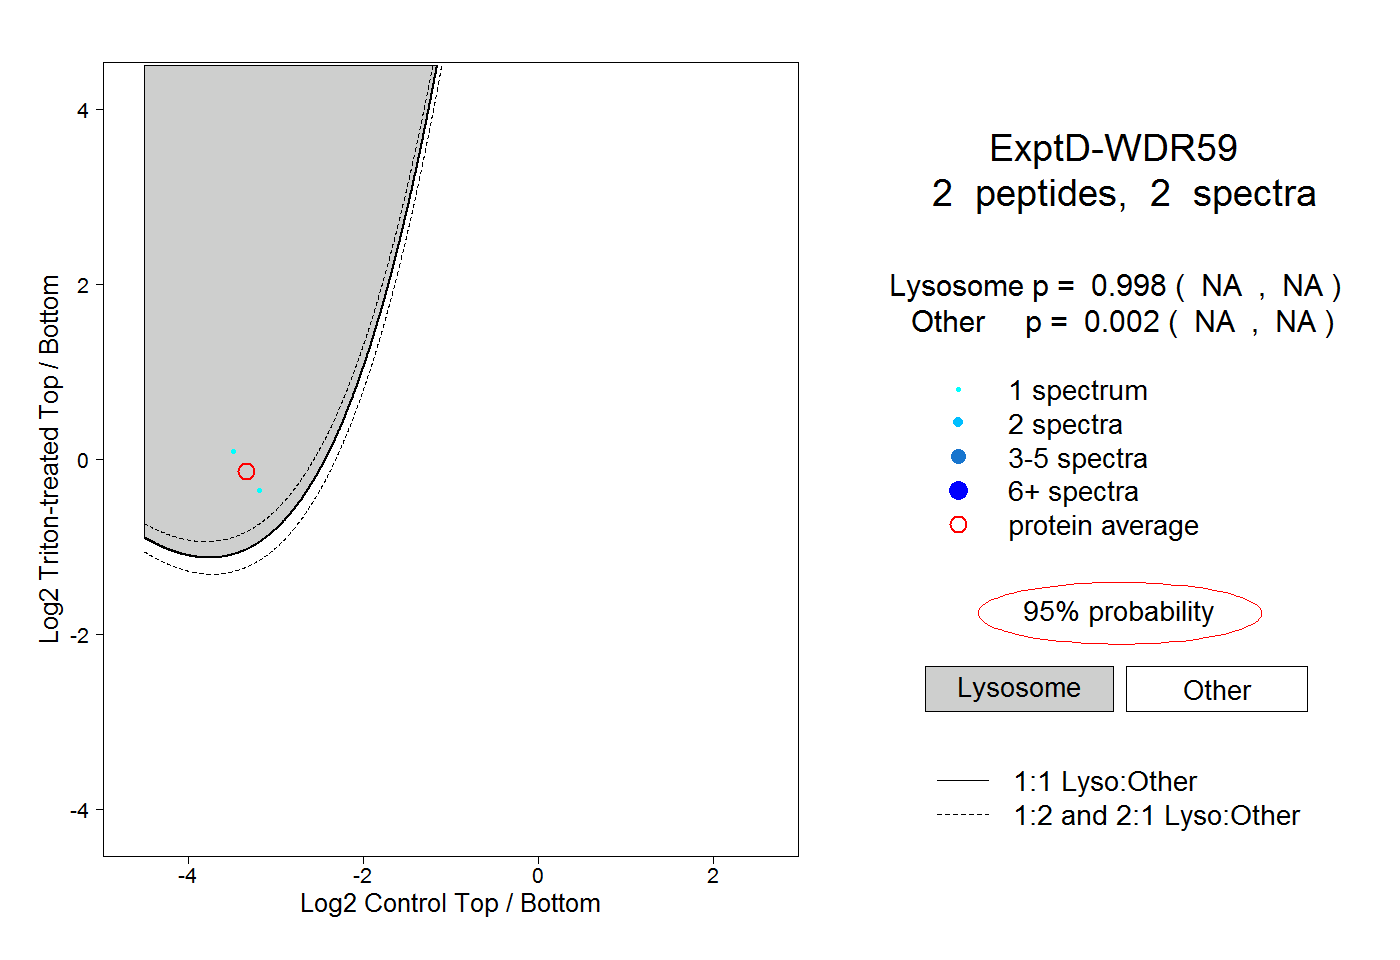
NA | NA
NA | NA