 9
9peptides
spectra
0.000 | 0.000
0.429 | 0.469
0.000 | 0.000
0.000 | 0.000
0.190 | 0.268
0.056 | 0.129
0.201 | 0.236
0.000 | 0.000
9peptides
spectra
0.999 | 1.000
0.000 | 0.001
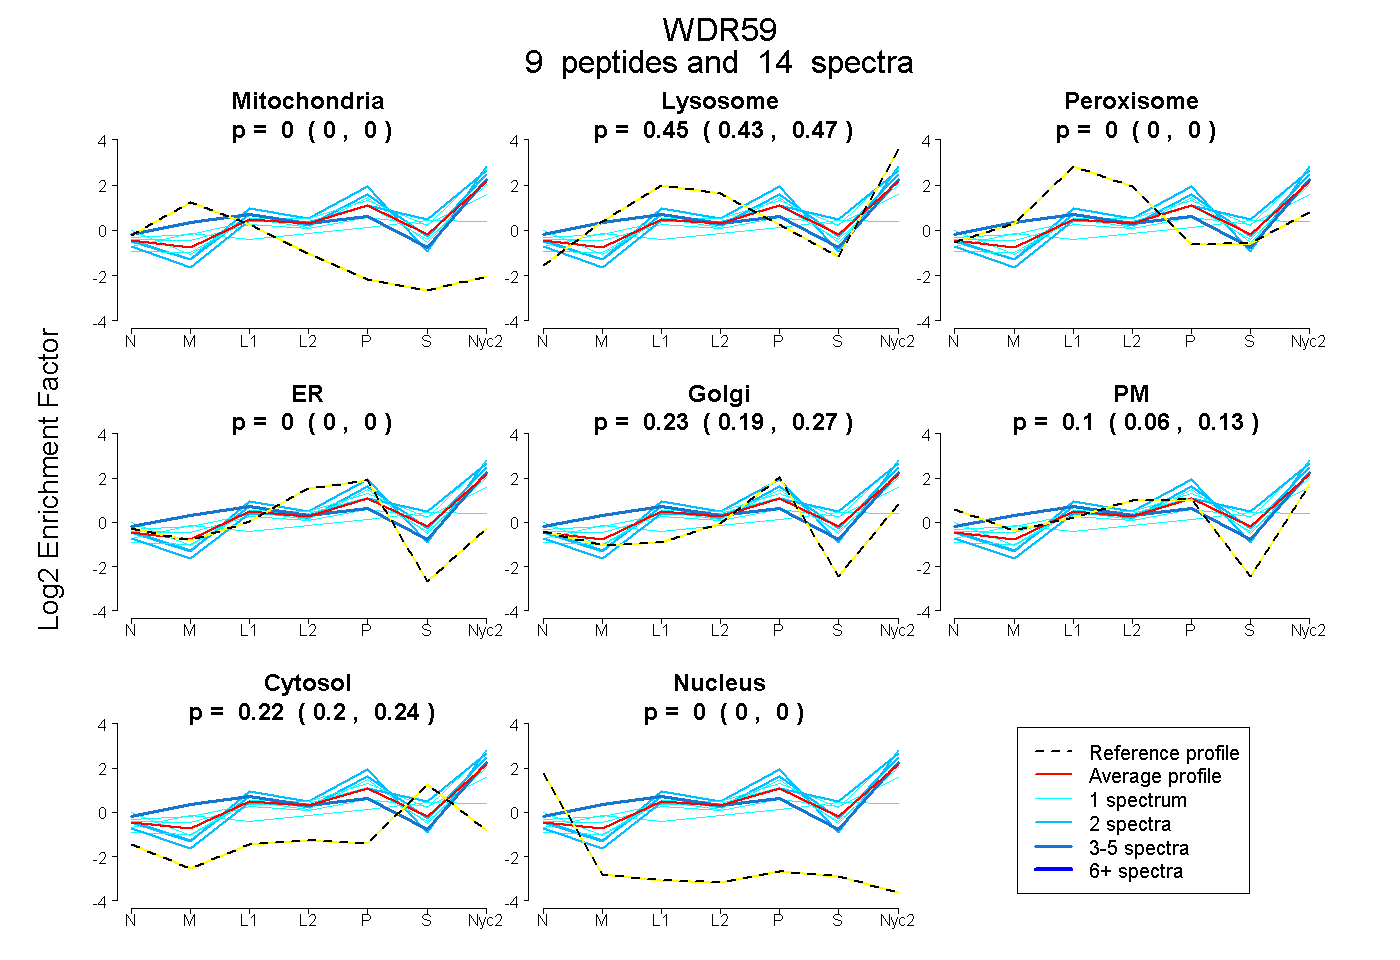
| Plot | Mito | Lyso | Perox | ER | Golgi | PM | Cytosol | Nucleus | |||||
| Expt A |
9 peptides |
14 spectra |
|
0.000 0.000 | 0.000 |
0.451 0.429 | 0.469 |
0.000 0.000 | 0.000 |
0.000 0.000 | 0.000 |
0.233 0.190 | 0.268 |
0.096 0.056 | 0.129 |
0.220 0.201 | 0.236 |
0.000 0.000 | 0.000 |
||
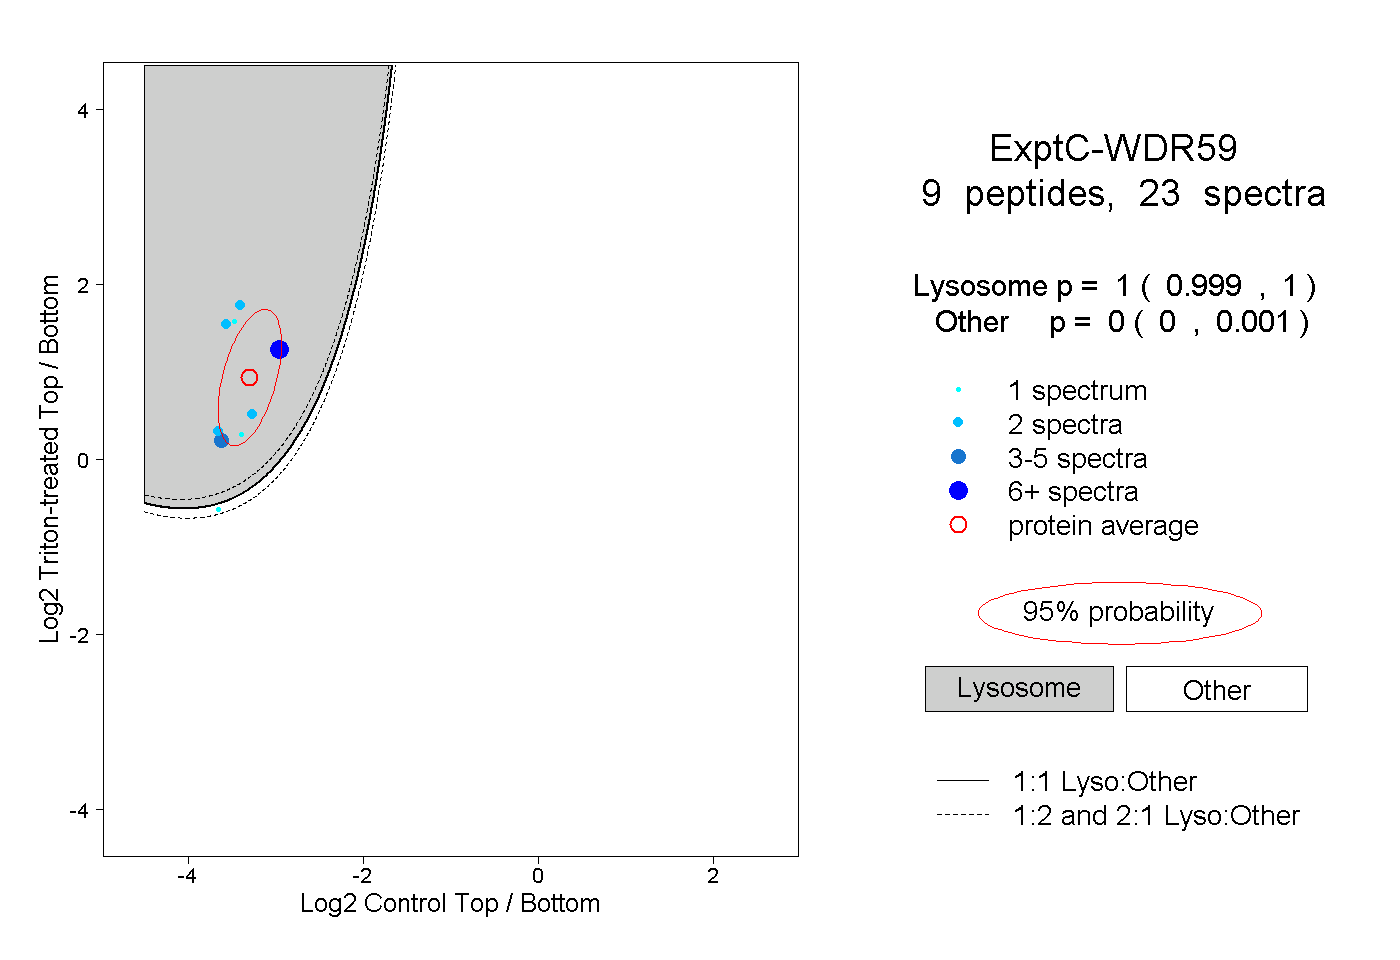
| Plot | Lyso | Other | |||||||||||
| Expt C |
9 peptides |
23 spectra |
|
1.000 0.999 | 1.000 |
0.000 0.000 | 0.001 |
| 2 spectra, EGSDSGNRPIK | 1.000 | 0.000 | ||||||||
| 2 spectra, DYQLVTWSR | 1.000 | 0.000 | ||||||||
| 2 spectra, SDPDLETPWAR | 1.000 | 0.000 | ||||||||
| 3 spectra, CYGEILYR | 1.000 | 0.000 | ||||||||
| 1 spectrum, AVSPTEPTPR | 1.000 | 0.000 | ||||||||
| 1 spectrum, KPAVALSAVAGASQVK | 0.315 | 0.685 | ||||||||
| 2 spectra, VIIQDVSCLLPVHK | 1.000 | 0.000 | ||||||||
| 9 spectra, VDYQMQR | 1.000 | 0.000 | ||||||||
| 1 spectrum, FGSLTYSDPR | 0.999 | 0.001 |
| Plot | Lyso | Other | |||||||||||
| Expt D |
2 peptides |
2 spectra |
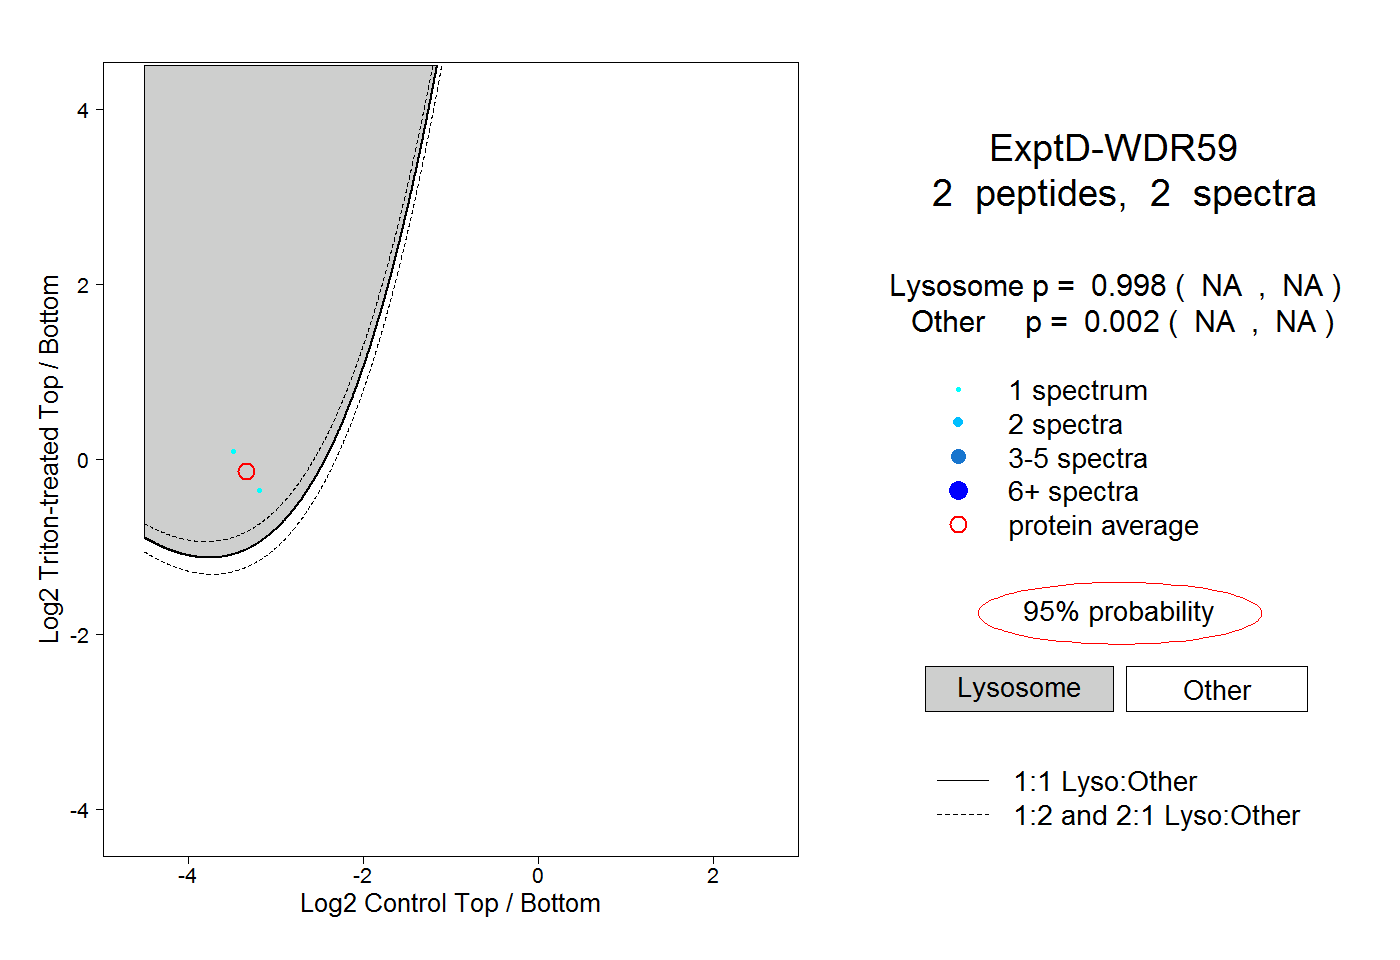 |
0.998 NA | NA |
0.002 NA | NA |