 8
8peptides
spectra
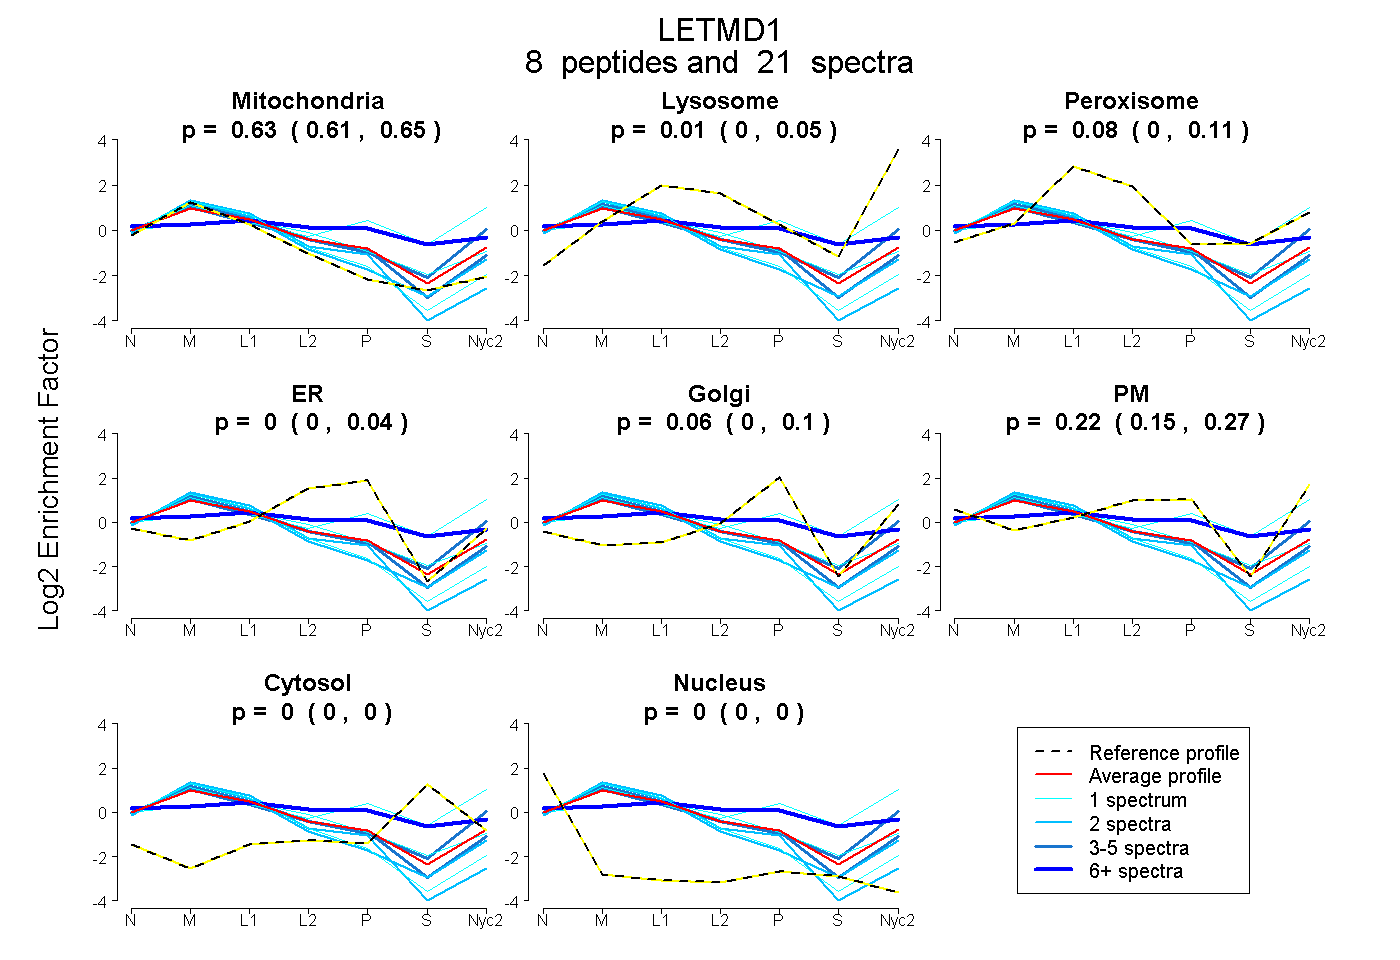
0.606 | 0.652
0.000 | 0.047
0.004 | 0.113
0.000 | 0.036
0.000 | 0.104
0.154 | 0.268
0.000 | 0.000
0.000 | 0.000
4peptides
spectra
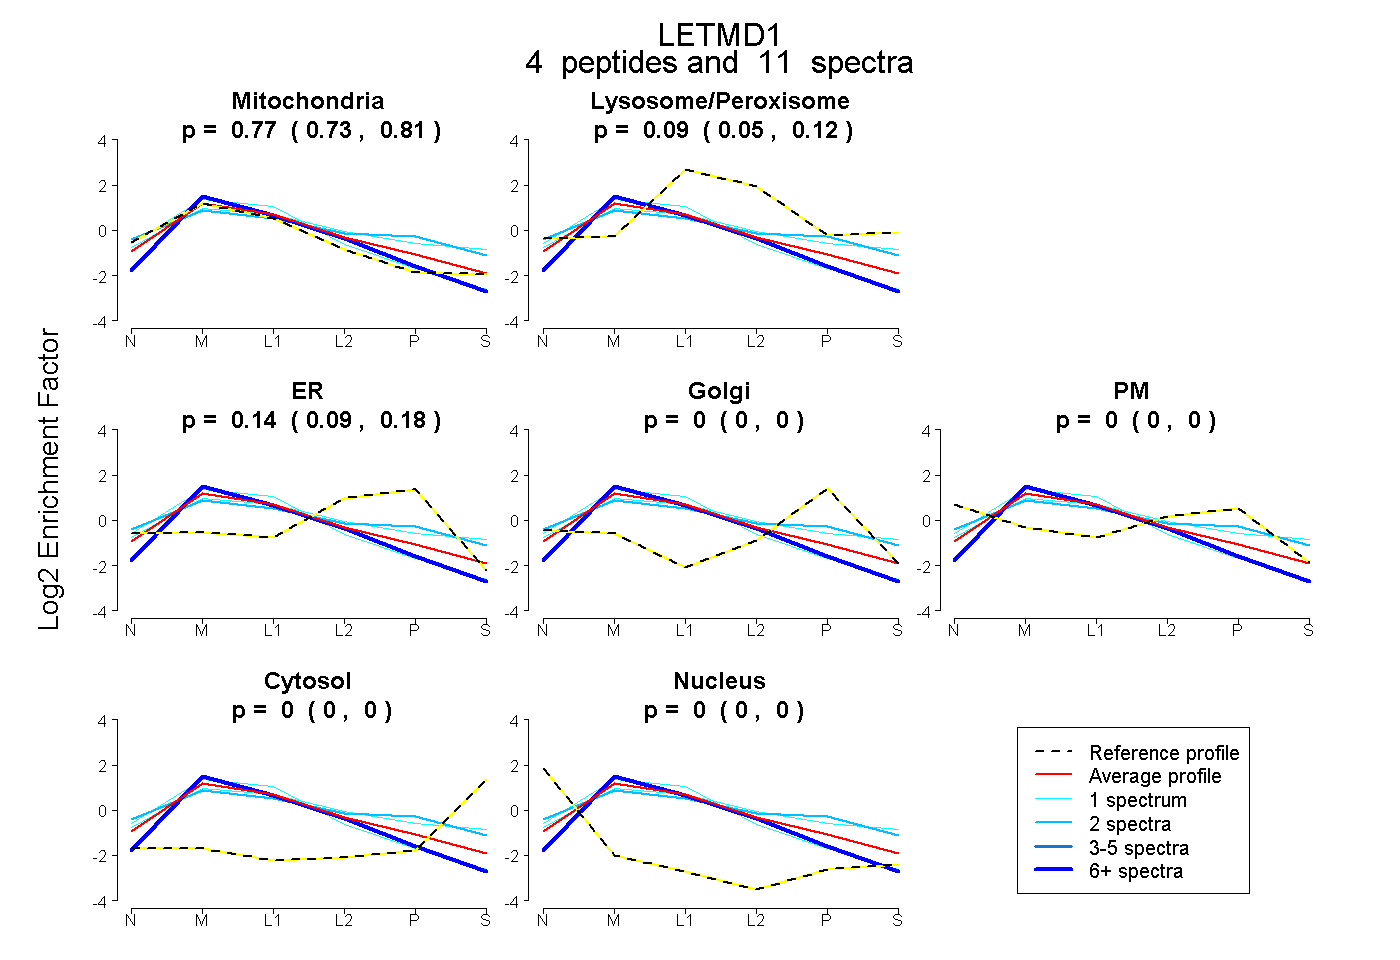
0.731 | 0.810
0.049 | 0.121
0.092 | 0.178
0.000 | 0.000
0.000 | 0.000
0.000 | 0.000
0.000 | 0.000
10peptides
spectra
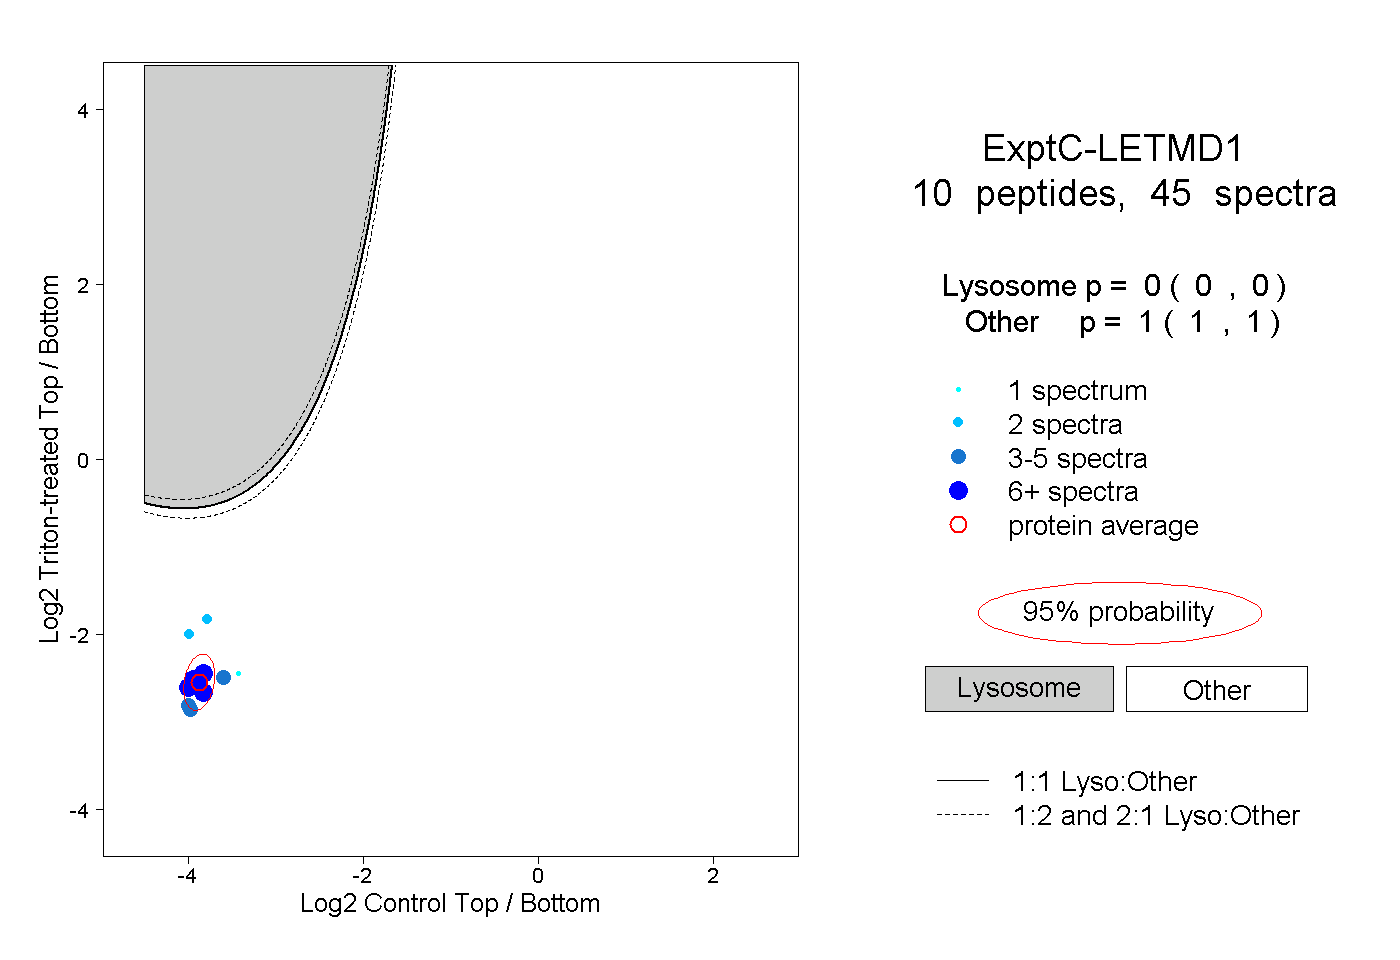
0.000 | 0.000
1.000 | 1.000
1peptide
spectrum
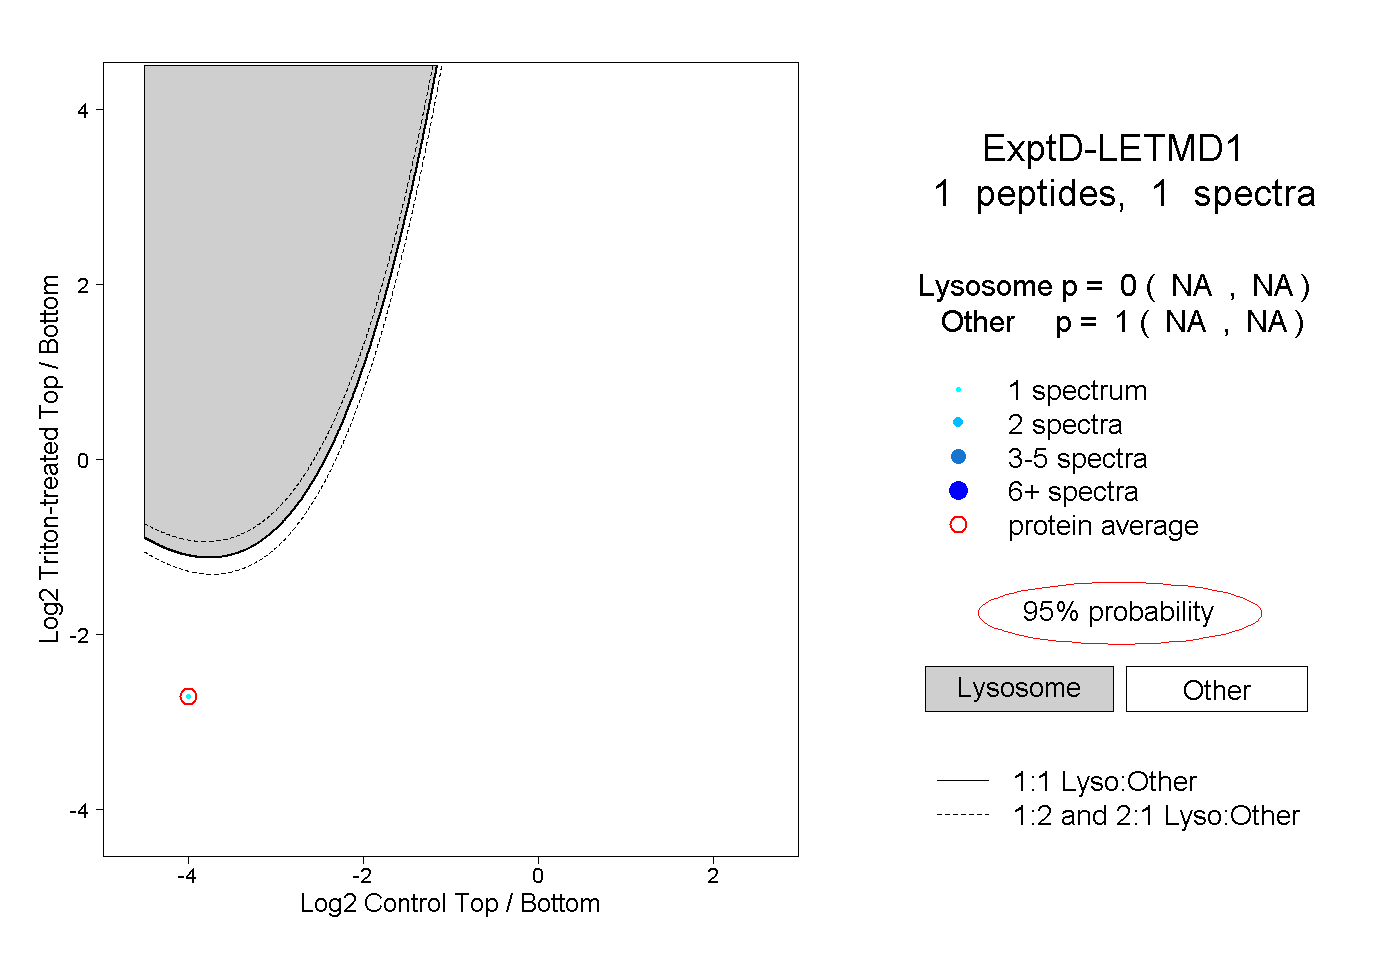
NA | NA
NA | NA