 8
8peptides
spectra
0.606 | 0.652
0.000 | 0.047
0.004 | 0.113
0.000 | 0.036
0.000 | 0.104
0.154 | 0.268
0.000 | 0.000
0.000 | 0.000
| Plot | Mito | Lyso | Perox | ER | Golgi | PM | Cytosol | Nucleus | |||||
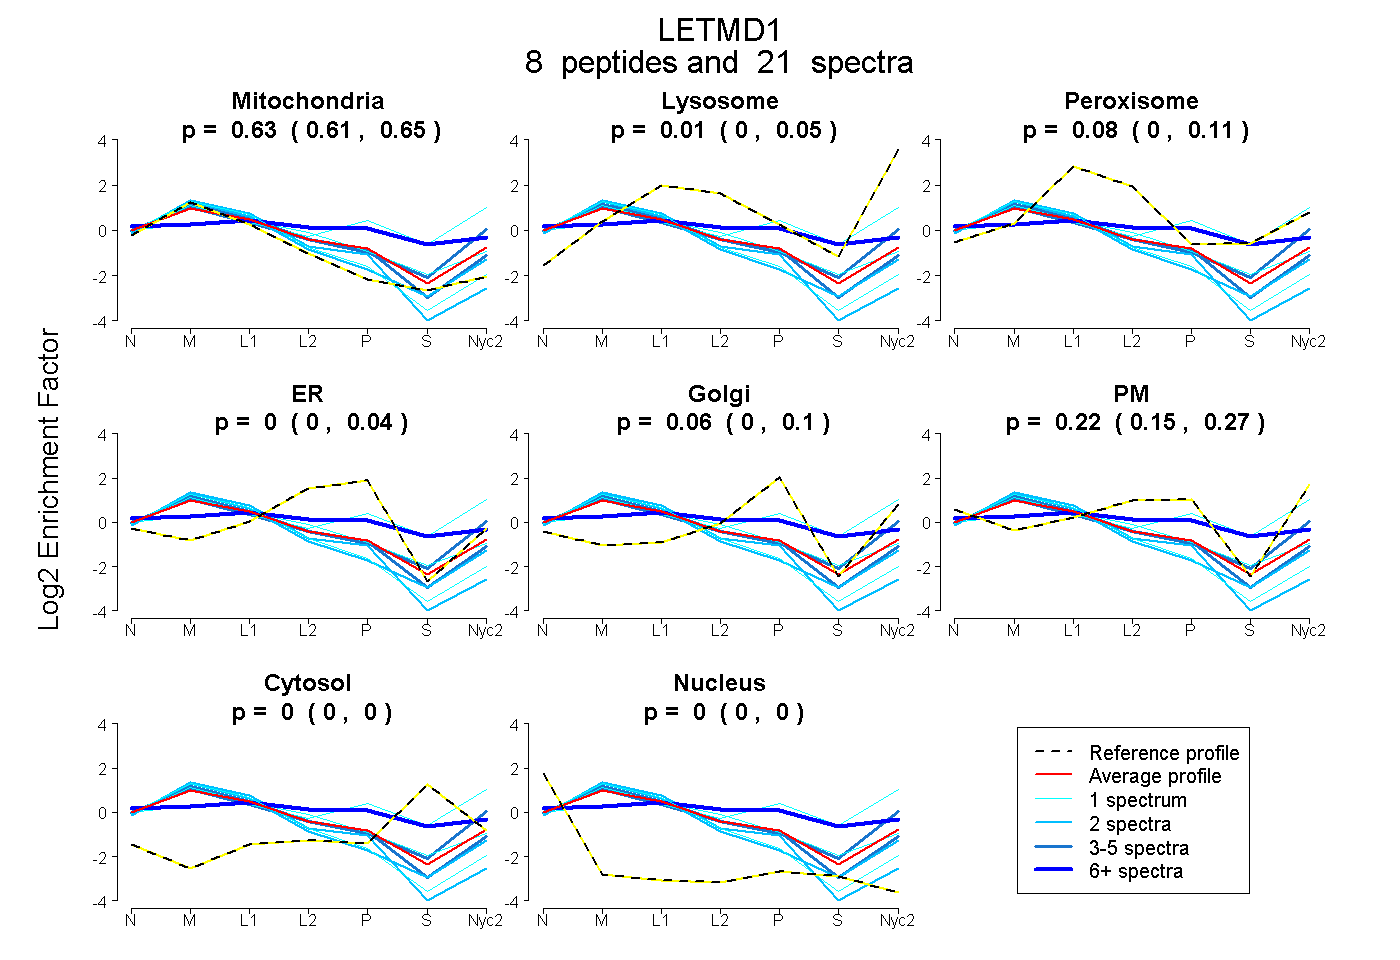
| Expt A |
8 peptides |
21 spectra |
|
0.628 0.606 | 0.652 |
0.012 0.000 | 0.047 |
0.075 0.004 | 0.113 |
0.000 0.000 | 0.036 |
0.063 0.000 | 0.104 |
0.221 0.154 | 0.268 |
0.000 0.000 | 0.000 |
0.000 0.000 | 0.000 |
| 6 spectra, SHTAVIHQLDR | 0.228 | 0.000 | 0.302 | 0.007 | 0.180 | 0.115 | 0.168 | 0.000 | ||
| 4 spectra, EMEHLR | 0.696 | 0.009 | 0.000 | 0.114 | 0.000 | 0.181 | 0.000 | 0.000 | ||
| 2 spectra, QQIDFLDIYHGFR | 0.863 | 0.000 | 0.000 | 0.137 | 0.000 | 0.000 | 0.000 | 0.000 | ||
| 1 spectrum, WHLEDLCTK | 0.903 | 0.000 | 0.000 | 0.097 | 0.000 | 0.000 | 0.000 | 0.000 | ||
| 2 spectra, NLISYVVTK | 0.858 | 0.053 | 0.000 | 0.000 | 0.000 | 0.090 | 0.000 | 0.000 | ||
| 4 spectra, FHQLSYR | 0.584 | 0.159 | 0.000 | 0.000 | 0.000 | 0.251 | 0.006 | 0.000 | ||
| 1 spectrum, GIQMLWADAK | 0.141 | 0.205 | 0.051 | 0.000 | 0.067 | 0.333 | 0.204 | 0.000 | ||
| 1 spectrum, HFWTPK | 0.613 | 0.000 | 0.178 | 0.031 | 0.074 | 0.104 | 0.000 | 0.000 |
| Plot | Mito | Lyso or Perox | ER | Golgi | PM | Cytosol | Nucleus | ||||||
| Expt B |
4 peptides |
11 spectra |
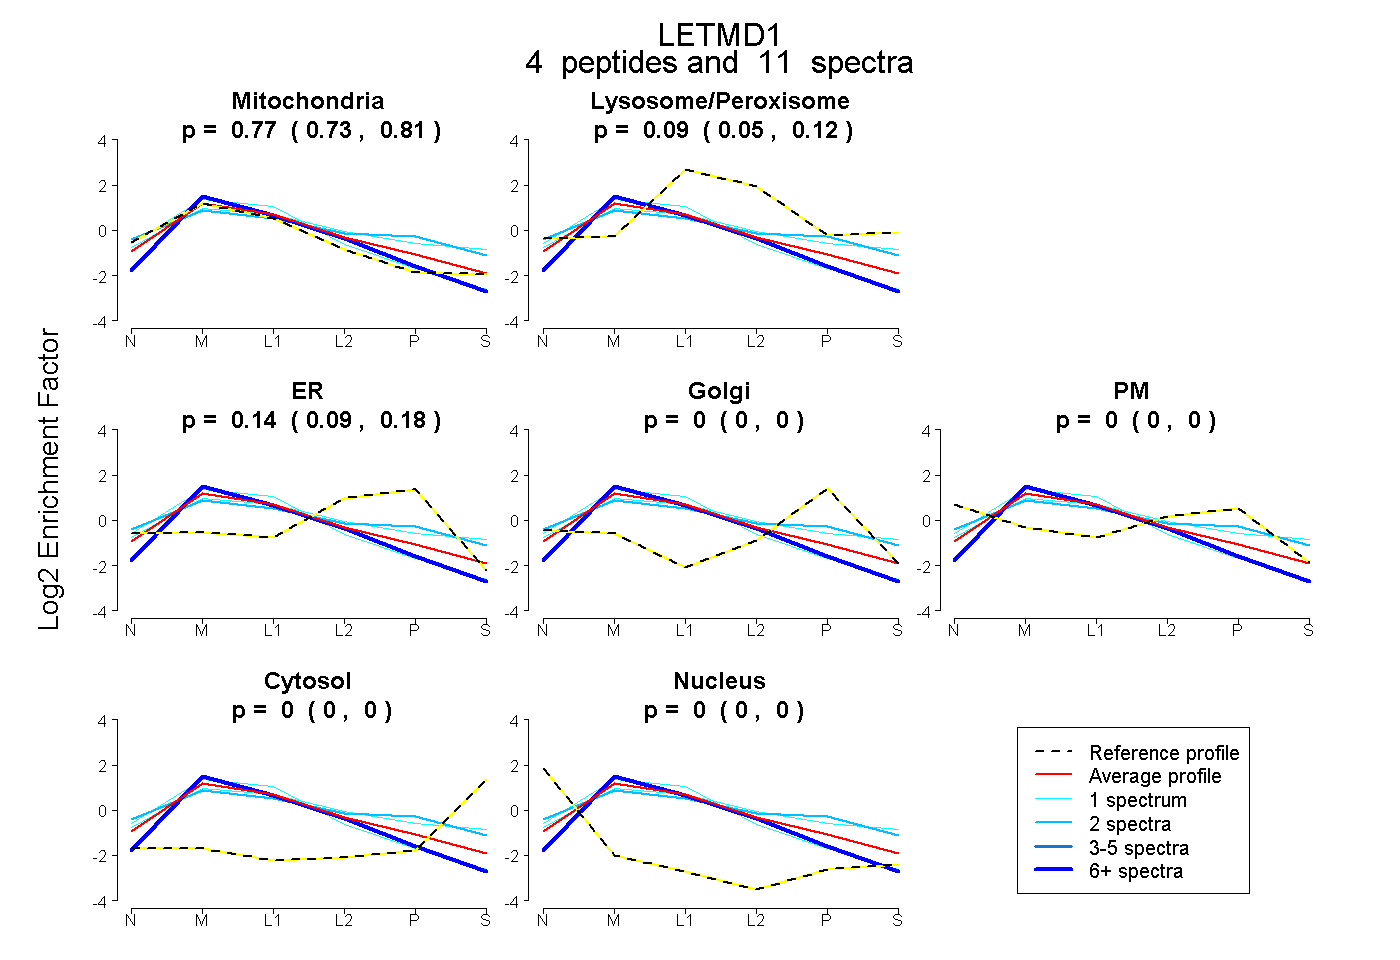 |
0.774 0.731 | 0.810 |
0.090 0.049 | 0.121 |
0.136 0.092 | 0.178 |
0.000 0.000 | 0.000 |
0.000 0.000 | 0.000 |
0.000 0.000 | 0.000 |
0.000 0.000 | 0.000 |
|||
| Plot | Lyso | Other | |||||||||||
| Expt C |
10 peptides |
45 spectra |
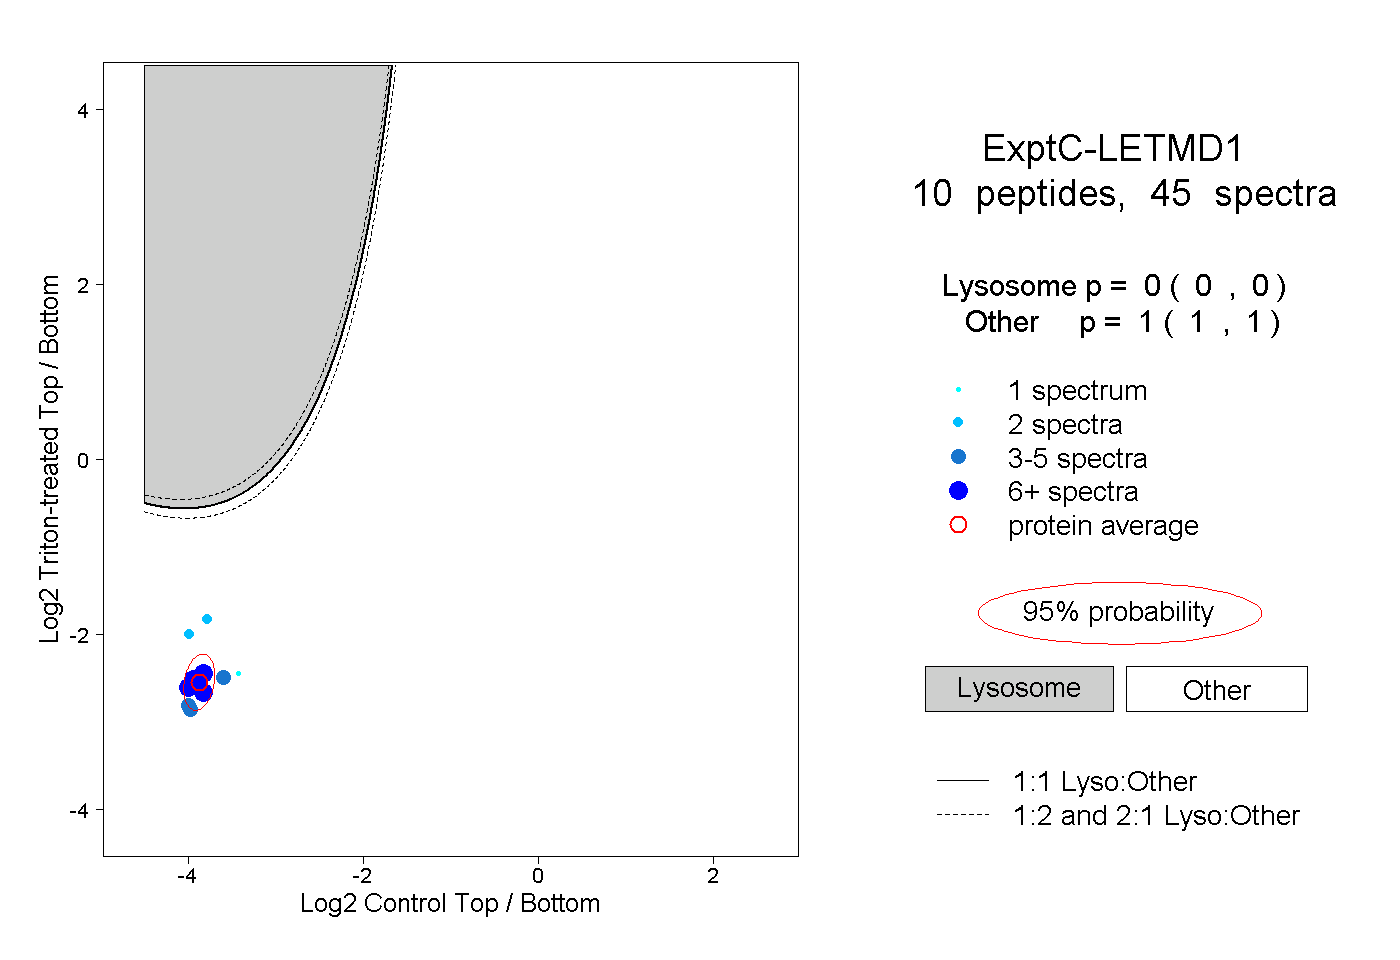 |
0.000 0.000 | 0.000 |
1.000 1.000 | 1.000 |
||||||||
| Plot | Lyso | Other | |||||||||||
| Expt D |
1 peptide |
1 spectrum |
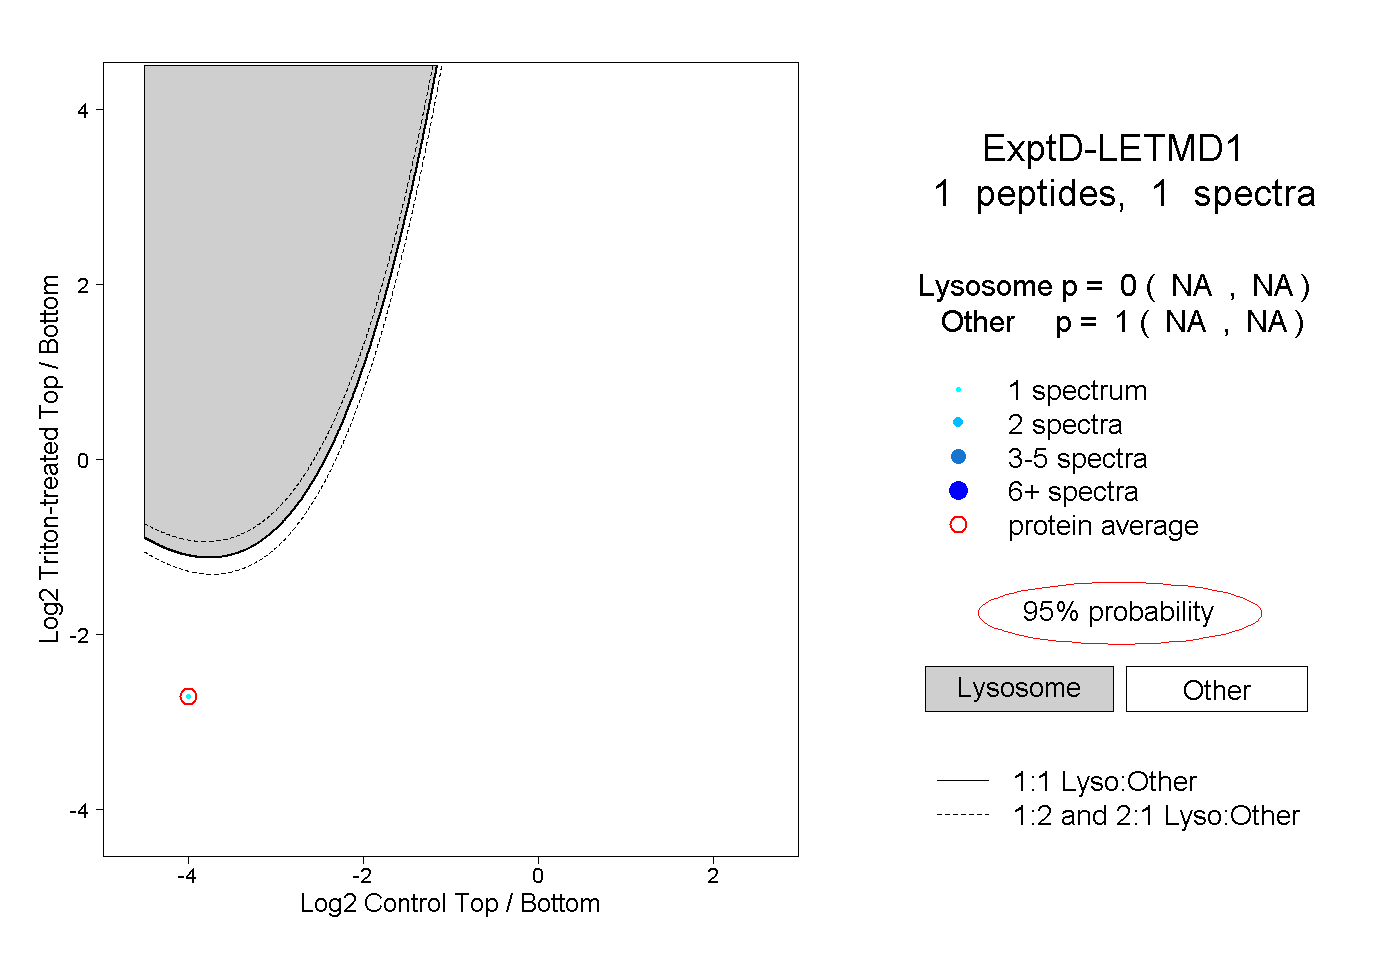 |
0.000 NA | NA |
1.000 NA | NA |