 2
2peptides
spectra
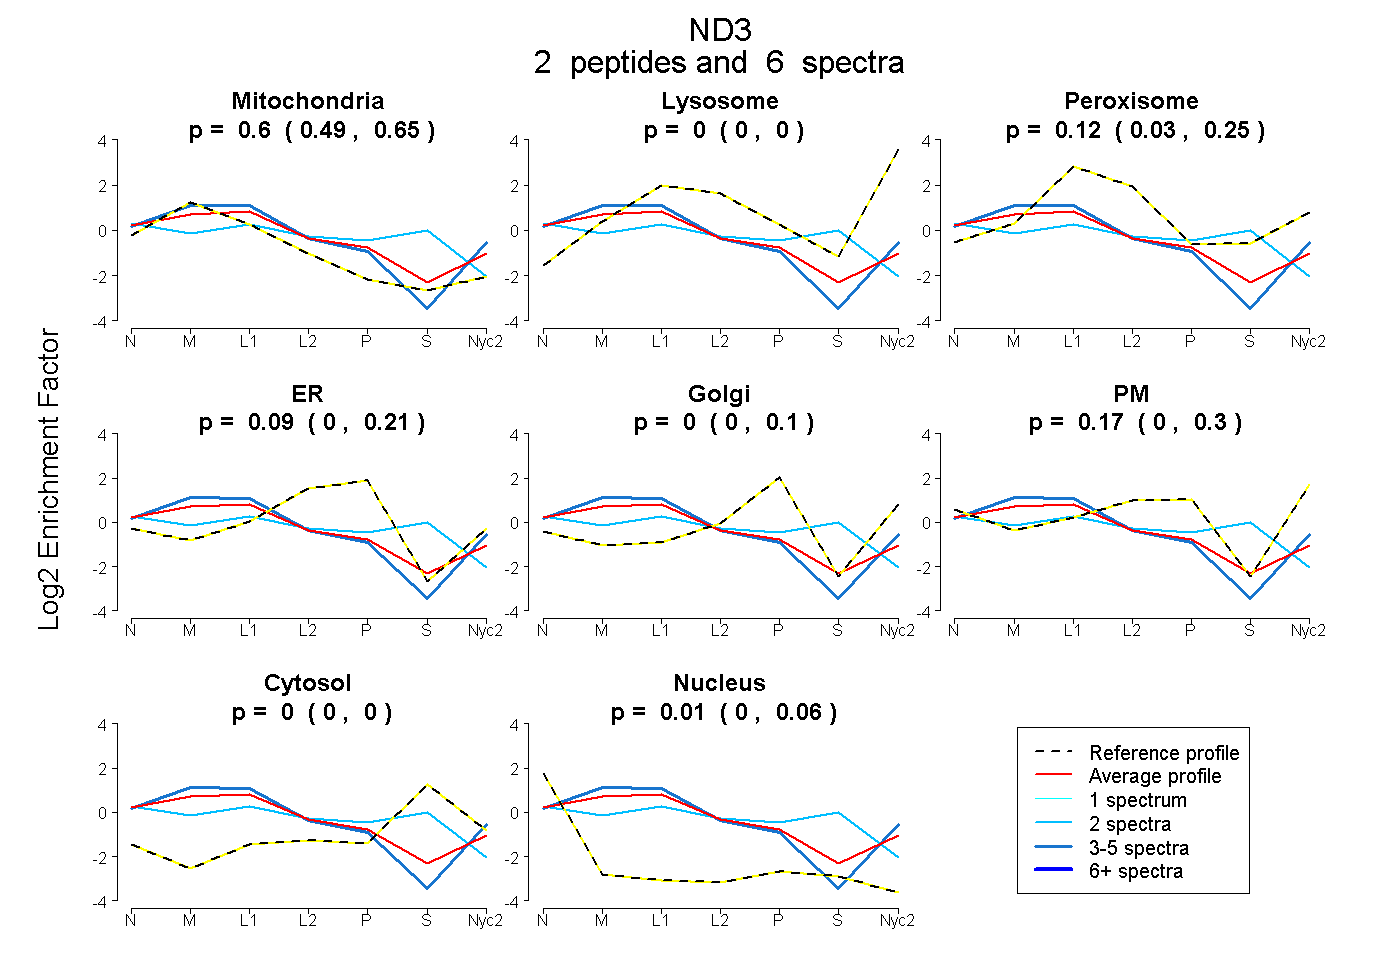
0.489 | 0.650
0.000 | 0.000
0.028 | 0.254
0.000 | 0.208
0.000 | 0.103
0.000 | 0.298
0.000 | 0.000
0.000 | 0.055
1peptide
spectra
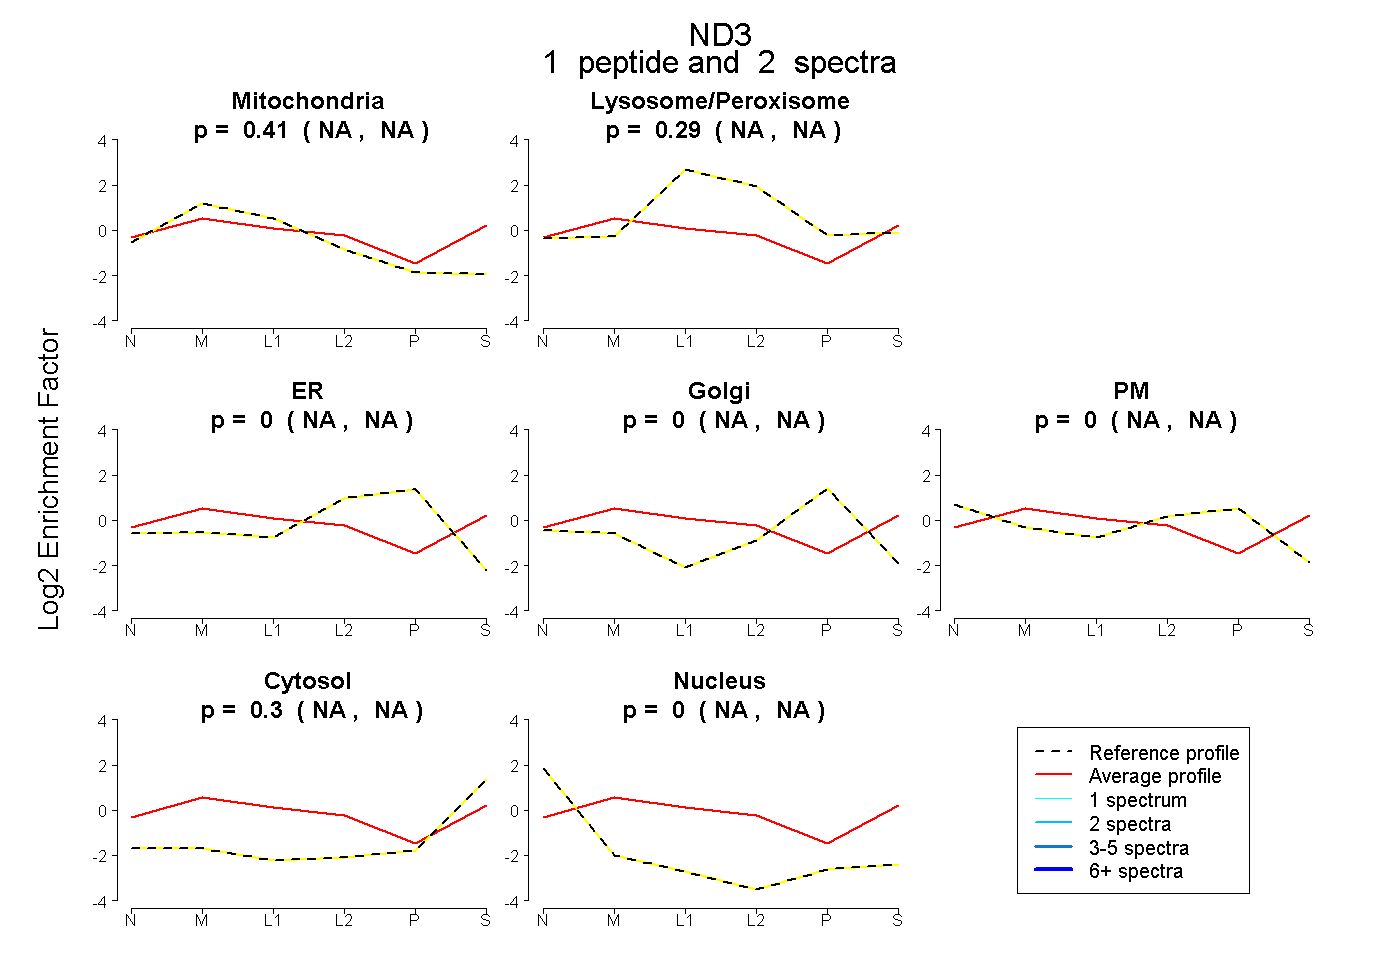
NA | NA
NA | NA
NA | NA
NA | NA
NA | NA
NA | NA
NA | NA
2peptides
spectra
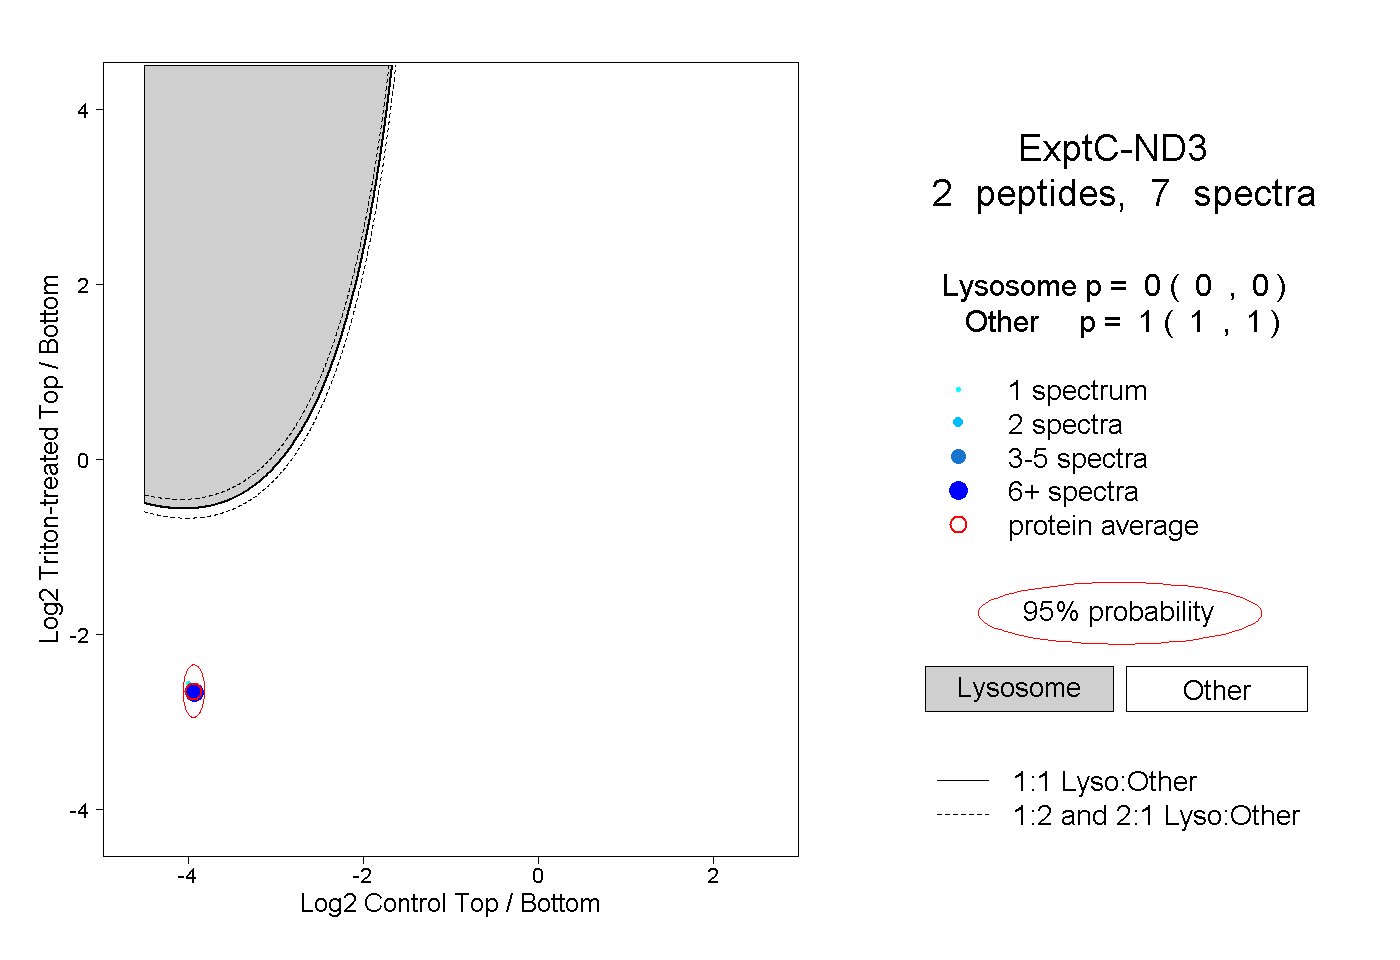
0.000 | 0.000
1.000 | 1.000
1peptide
spectrum
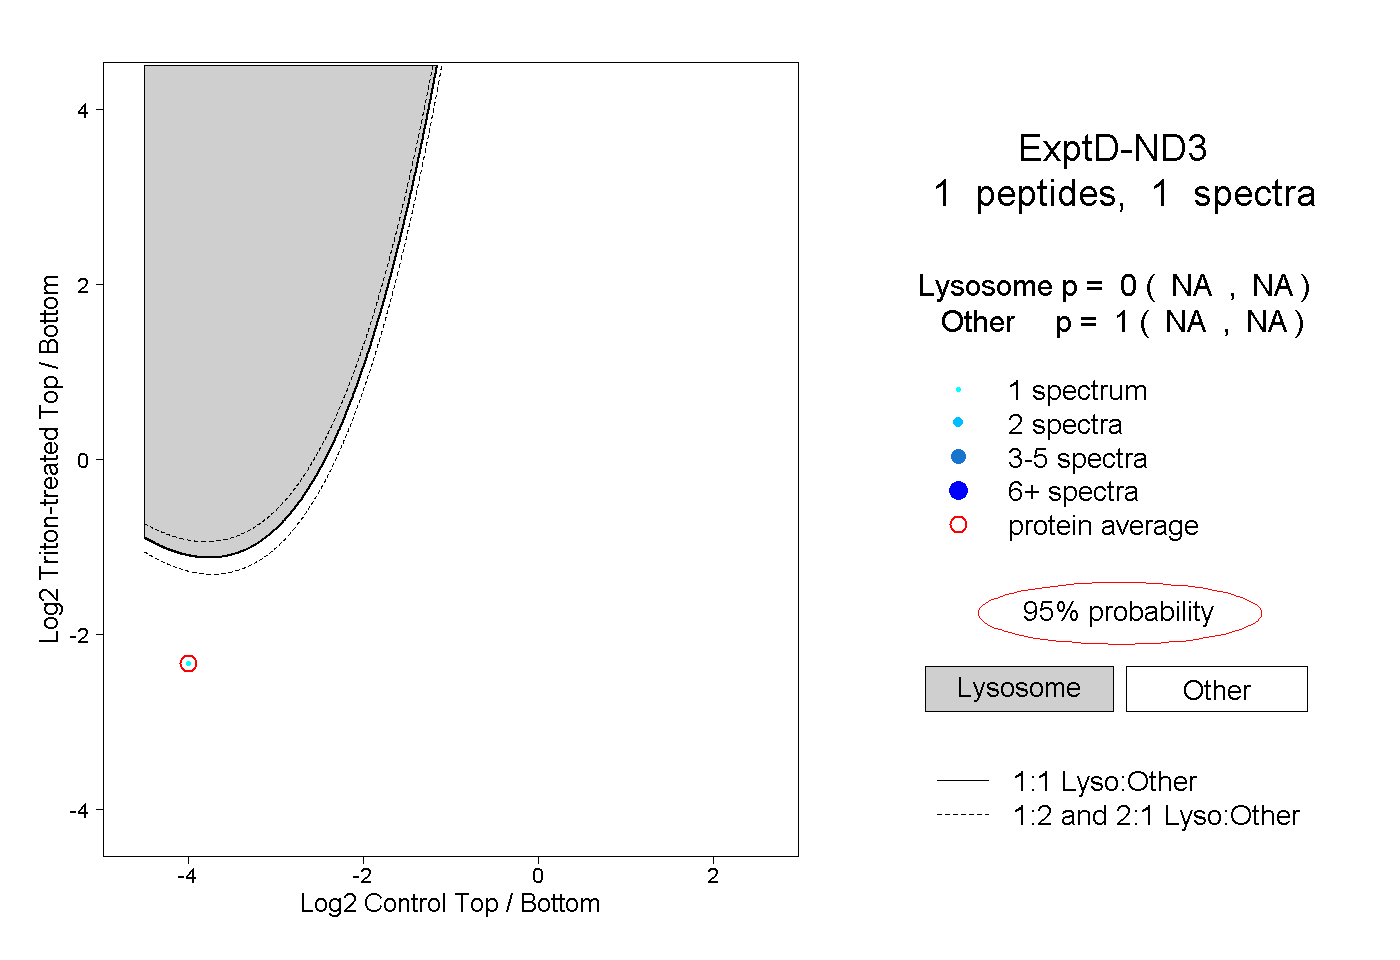
NA | NA
NA | NA