 2
2peptides
spectra
0.489 | 0.650
0.000 | 0.000
0.028 | 0.254
0.000 | 0.208
0.000 | 0.103
0.000 | 0.298
0.000 | 0.000
0.000 | 0.055
| Plot | Mito | Lyso | Perox | ER | Golgi | PM | Cytosol | Nucleus | |||||
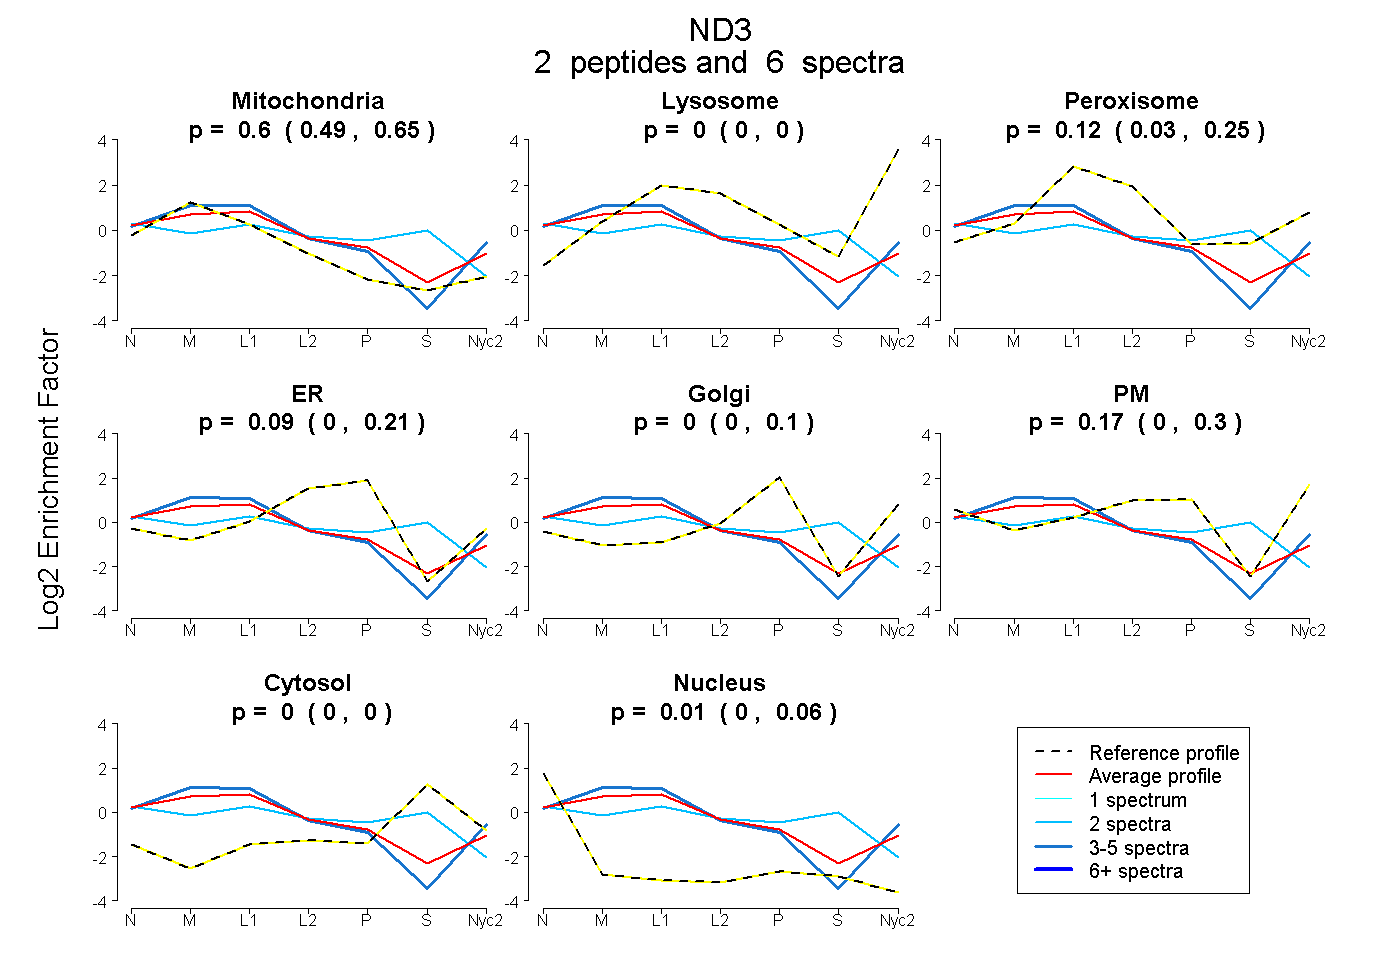
| Expt A |
2 peptides |
6 spectra |
|
0.600 0.489 | 0.650 |
0.000 0.000 | 0.000 |
0.124 0.028 | 0.254 |
0.095 0.000 | 0.208 |
0.000 0.000 | 0.103 |
0.172 0.000 | 0.298 |
0.000 0.000 | 0.000 |
0.009 0.000 | 0.055 |
| 4 spectra, GLEWTE | 0.648 | 0.042 | 0.000 | 0.000 | 0.000 | 0.310 | 0.000 | 0.000 | ||
| 2 spectra, ANPYECGFDPTSSAR | 0.284 | 0.000 | 0.236 | 0.105 | 0.000 | 0.000 | 0.298 | 0.077 |
| Plot | Mito | Lyso or Perox | ER | Golgi | PM | Cytosol | Nucleus | ||||||
| Expt B |
1 peptide |
2 spectra |
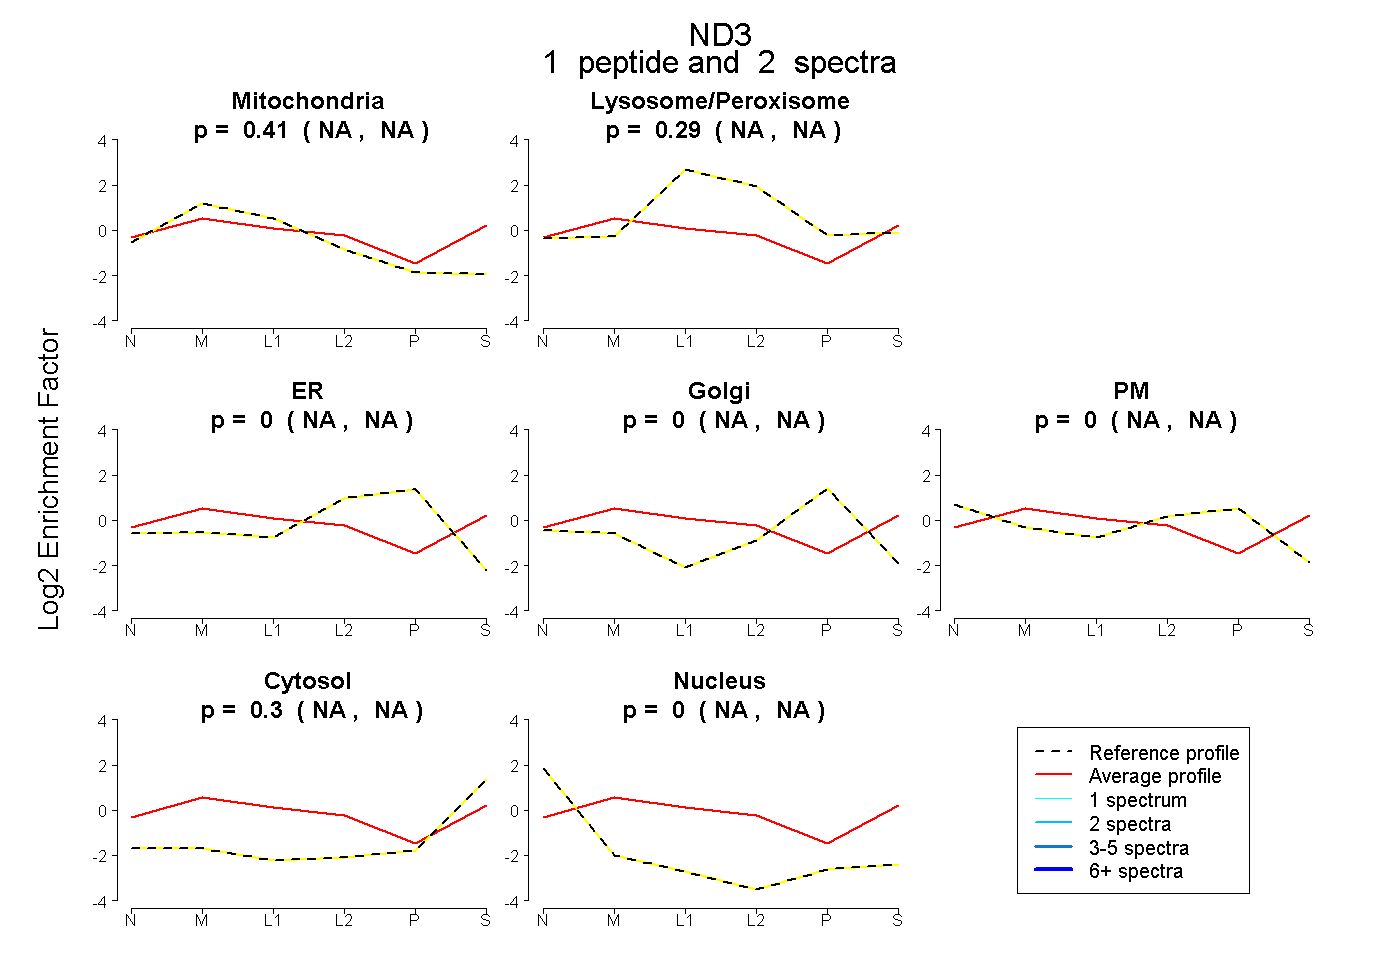 |
0.405 NA | NA |
0.294 NA | NA |
0.000 NA | NA |
0.000 NA | NA |
0.000 NA | NA |
0.301 NA | NA |
0.000 NA | NA |
|||
| Plot | Lyso | Other | |||||||||||
| Expt C |
2 peptides |
7 spectra |
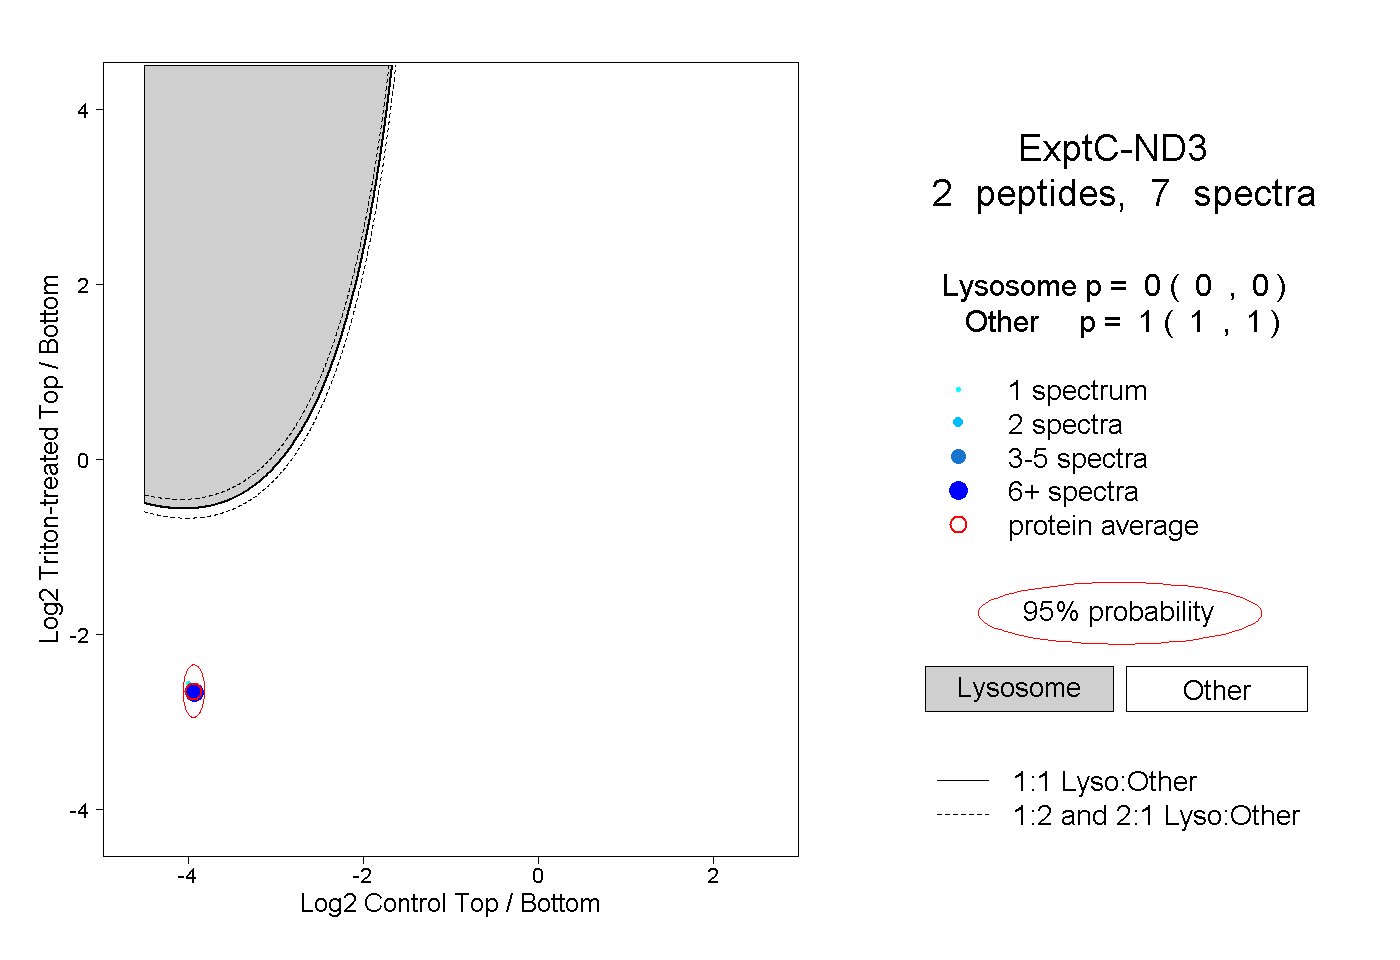 |
0.000 0.000 | 0.000 |
1.000 1.000 | 1.000 |
||||||||
| Plot | Lyso | Other | |||||||||||
| Expt D |
1 peptide |
1 spectrum |
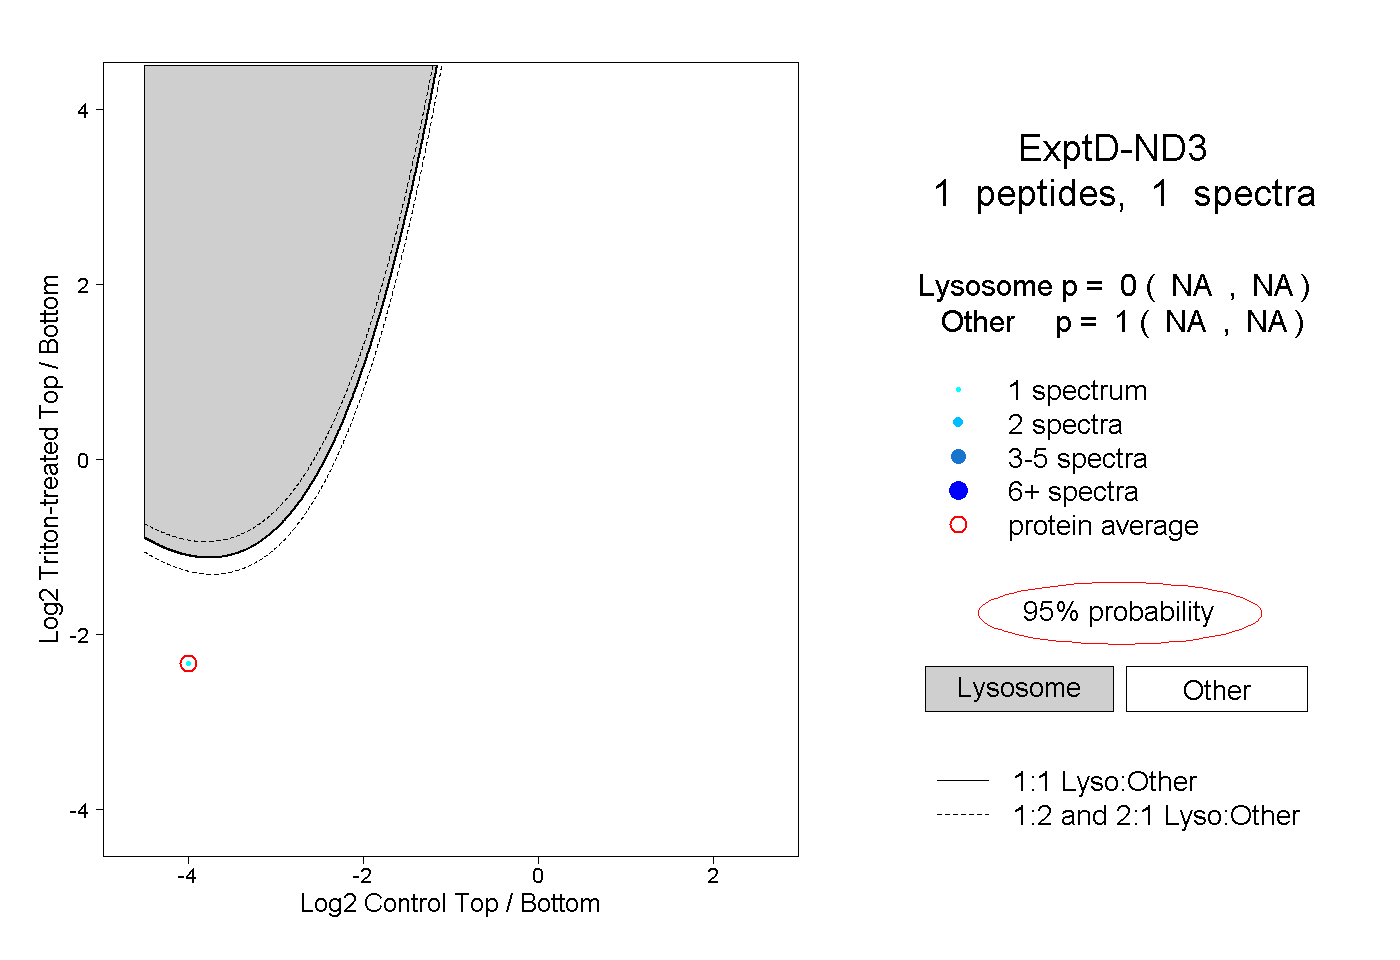 |
0.000 NA | NA |
1.000 NA | NA |