 11
11peptides
spectra
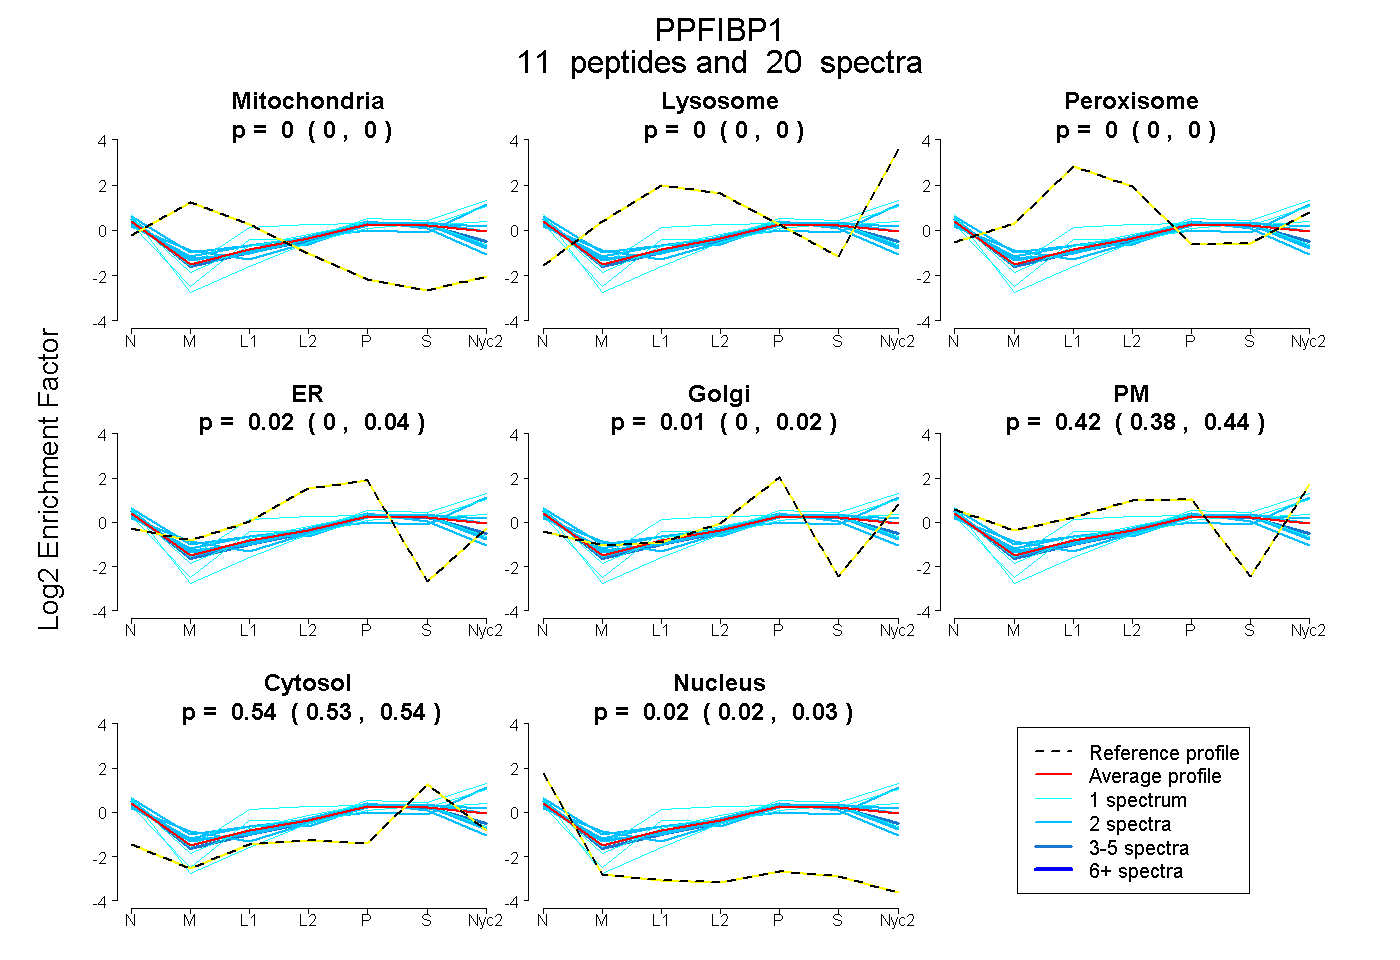
0.000 | 0.000
0.000 | 0.000
0.000 | 0.000
0.000 | 0.045
0.000 | 0.020
0.384 | 0.439
0.531 | 0.539
0.016 | 0.031
3peptides
spectra
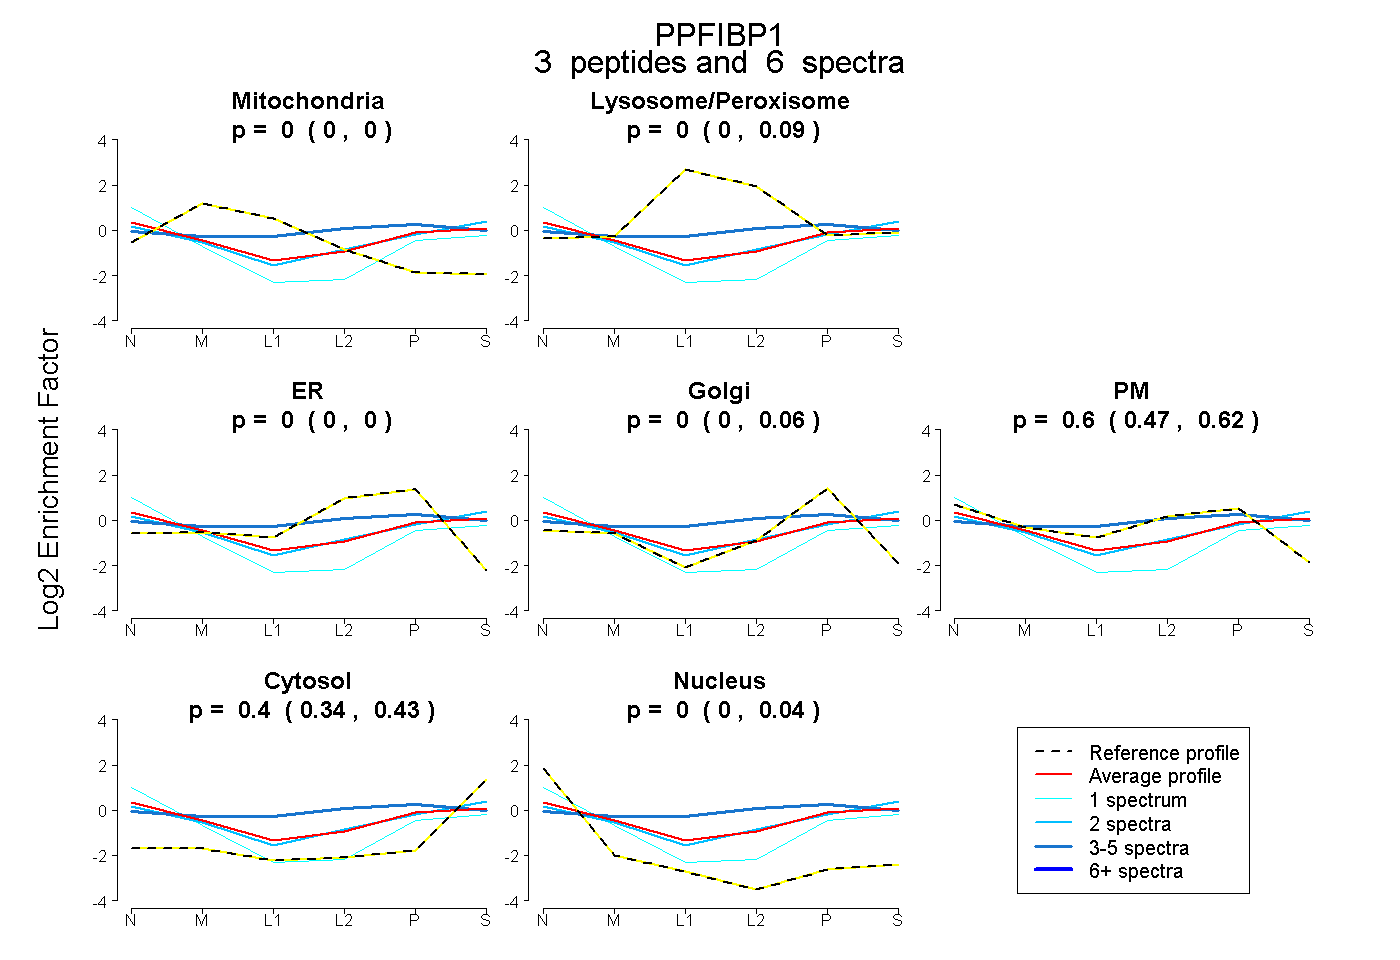
0.000 | 0.000
0.000 | 0.087
0.000 | 0.000
0.000 | 0.059
0.472 | 0.623
0.336 | 0.427
0.000 | 0.045
9peptides
spectra
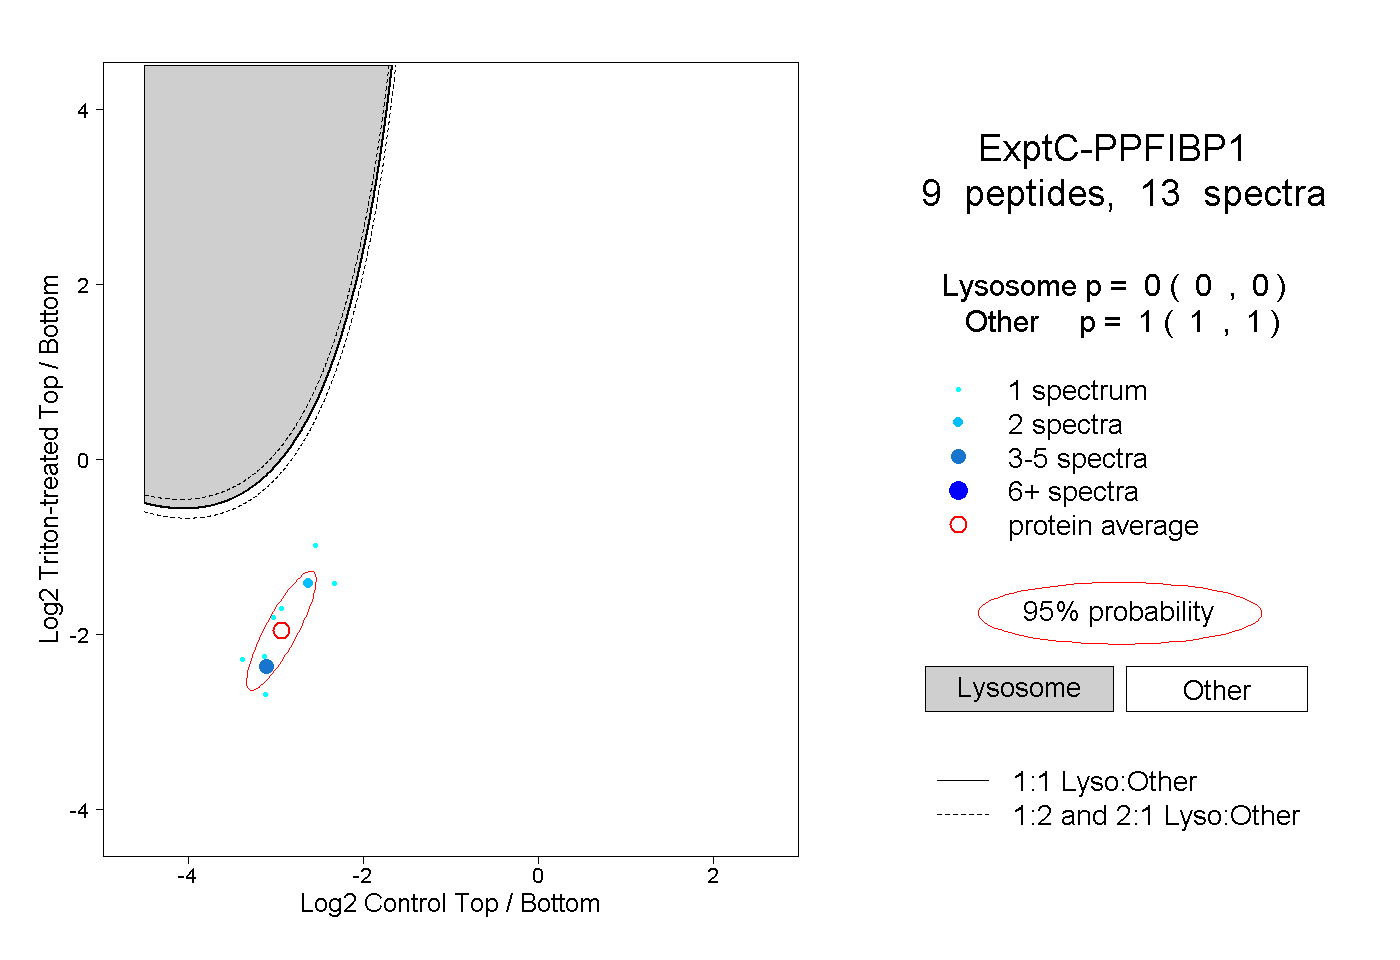
0.000 | 0.000
1.000 | 1.000