 11
11peptides
spectra
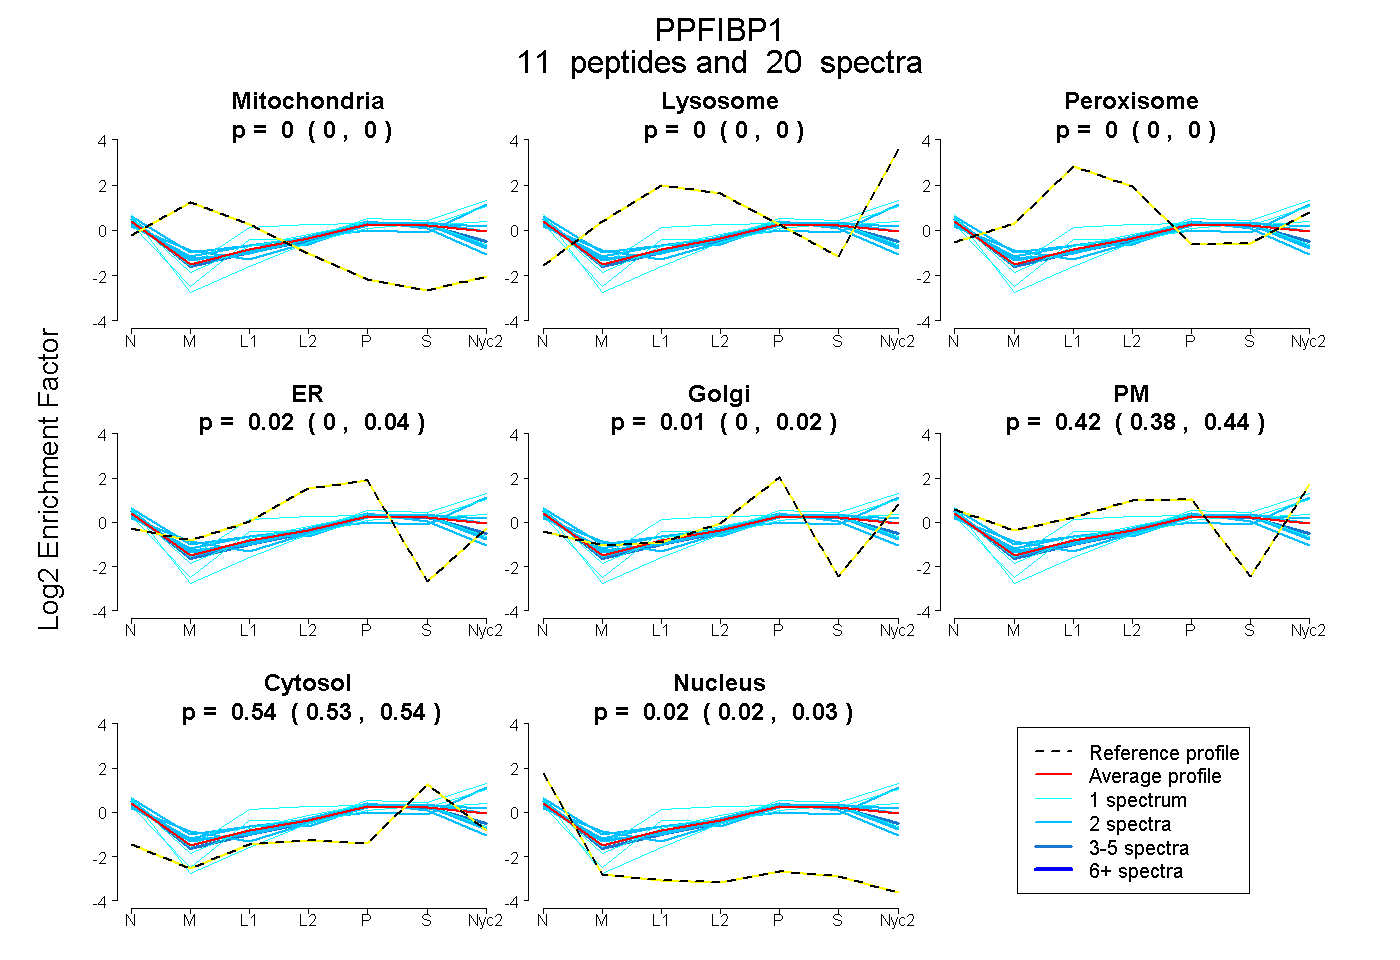
0.000 | 0.000
0.000 | 0.000
0.000 | 0.000
0.000 | 0.045
0.000 | 0.020
0.384 | 0.439
0.531 | 0.539
0.016 | 0.031
| Plot | Mito | Lyso | Perox | ER | Golgi | PM | Cytosol | Nucleus | |||||
| Expt A |
11 peptides |
20 spectra |
|
0.000 0.000 | 0.000 |
0.000 0.000 | 0.000 |
0.000 0.000 | 0.000 |
0.015 0.000 | 0.045 |
0.005 0.000 | 0.020 |
0.420 0.384 | 0.439 |
0.535 0.531 | 0.539 |
0.024 0.016 | 0.031 |
| 2 spectra, DTEGLIQEINDLR | 0.000 | 0.000 | 0.000 | 0.000 | 0.006 | 0.443 | 0.550 | 0.000 | ||
| 2 spectra, APGHGASVDDSPFGTR | 0.000 | 0.000 | 0.018 | 0.342 | 0.000 | 0.077 | 0.463 | 0.101 | ||
| 1 spectrum, LDFNWVTR | 0.000 | 0.014 | 0.131 | 0.000 | 0.000 | 0.457 | 0.398 | 0.000 | ||
| 2 spectra, LATKPETSFEEGDGR | 0.000 | 0.000 | 0.007 | 0.206 | 0.000 | 0.192 | 0.526 | 0.069 | ||
| 4 spectra, ALHLVEDLR | 0.000 | 0.000 | 0.000 | 0.134 | 0.015 | 0.265 | 0.520 | 0.067 | ||
| 1 spectrum, LYEEDDLDR | 0.000 | 0.000 | 0.000 | 0.060 | 0.118 | 0.141 | 0.554 | 0.128 | ||
| 1 spectrum, LTFSNFGNLR | 0.000 | 0.000 | 0.000 | 0.000 | 0.000 | 0.474 | 0.526 | 0.000 | ||
| 2 spectra, DLGQSNSDLDTPFAK | 0.000 | 0.000 | 0.000 | 0.000 | 0.000 | 0.569 | 0.431 | 0.000 | ||
| 1 spectrum, STSSTPGMGSPSR | 0.000 | 0.030 | 0.000 | 0.000 | 0.000 | 0.446 | 0.524 | 0.000 | ||
| 2 spectra, LELMAEISNLK | 0.046 | 0.000 | 0.000 | 0.128 | 0.081 | 0.174 | 0.527 | 0.043 | ||
| 2 spectra, VNEMDSER | 0.000 | 0.000 | 0.000 | 0.021 | 0.031 | 0.387 | 0.561 | 0.000 |
| Plot | Mito | Lyso or Perox | ER | Golgi | PM | Cytosol | Nucleus | ||||||
| Expt B |
3 peptides |
6 spectra |
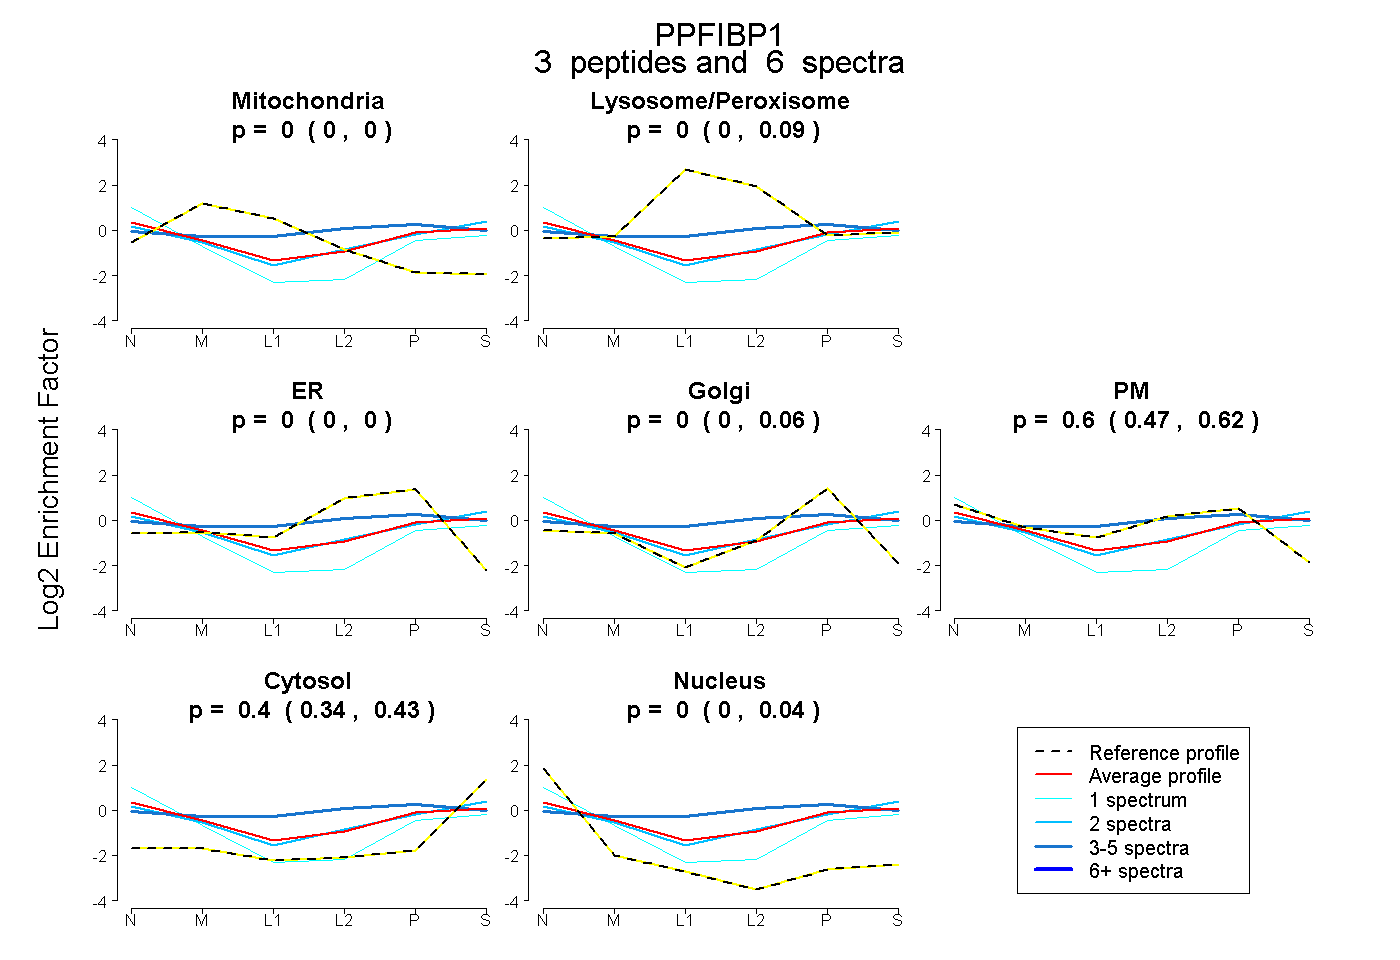 |
0.000 0.000 | 0.000 |
0.000 0.000 | 0.087 |
0.000 0.000 | 0.000 |
0.000 0.000 | 0.059 |
0.604 0.472 | 0.623 |
0.396 0.336 | 0.427 |
0.000 0.000 | 0.045 |
|||
| Plot | Lyso | Other | |||||||||||
| Expt C |
9 peptides |
13 spectra |
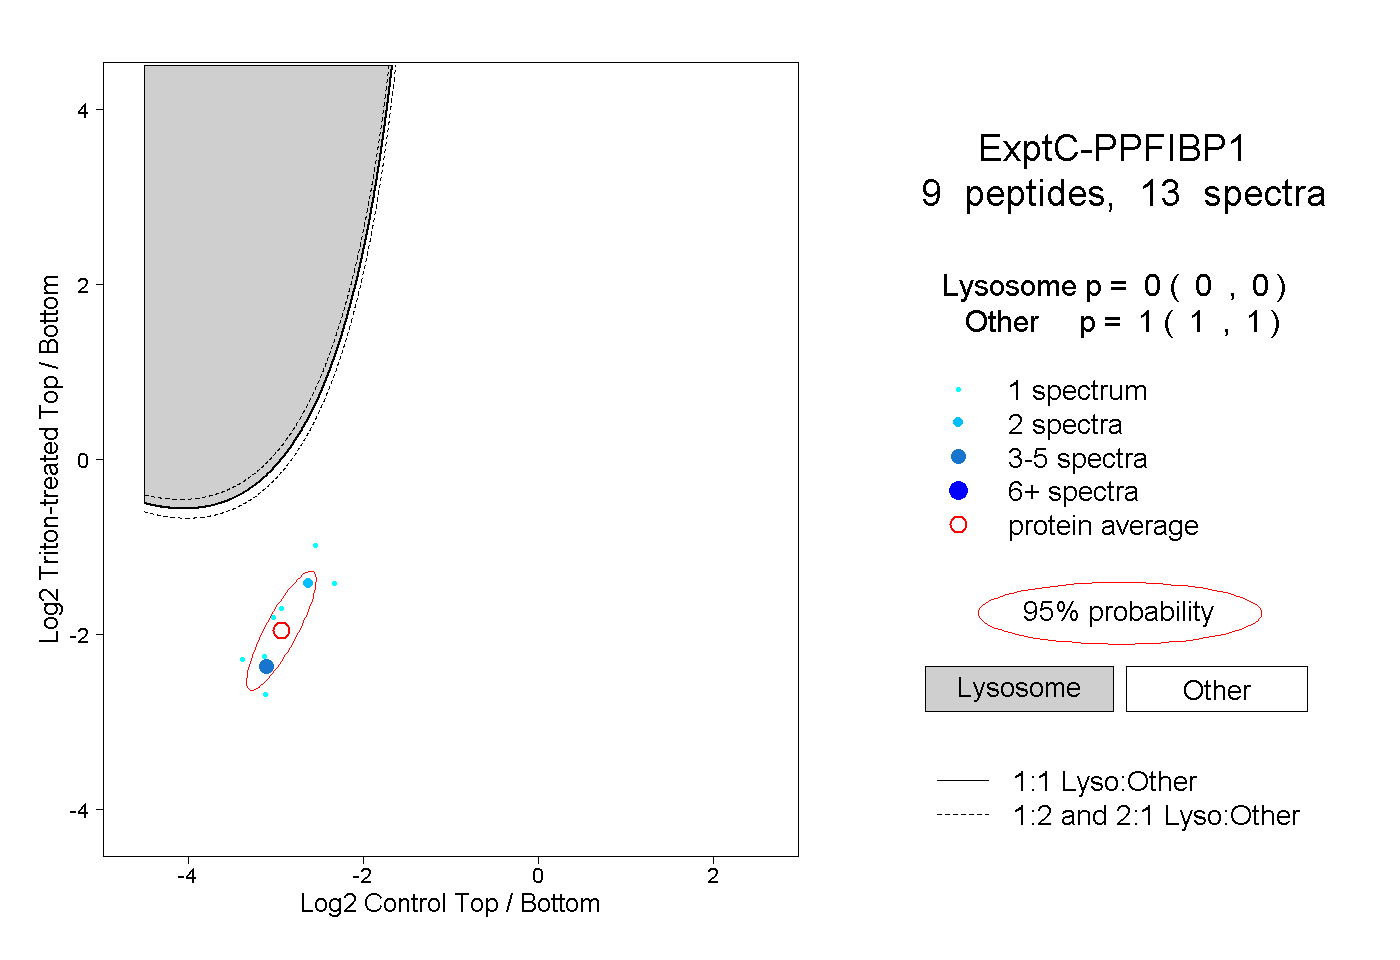 |
0.000 0.000 | 0.000 |
1.000 1.000 | 1.000 |