 7
7peptides
spectra
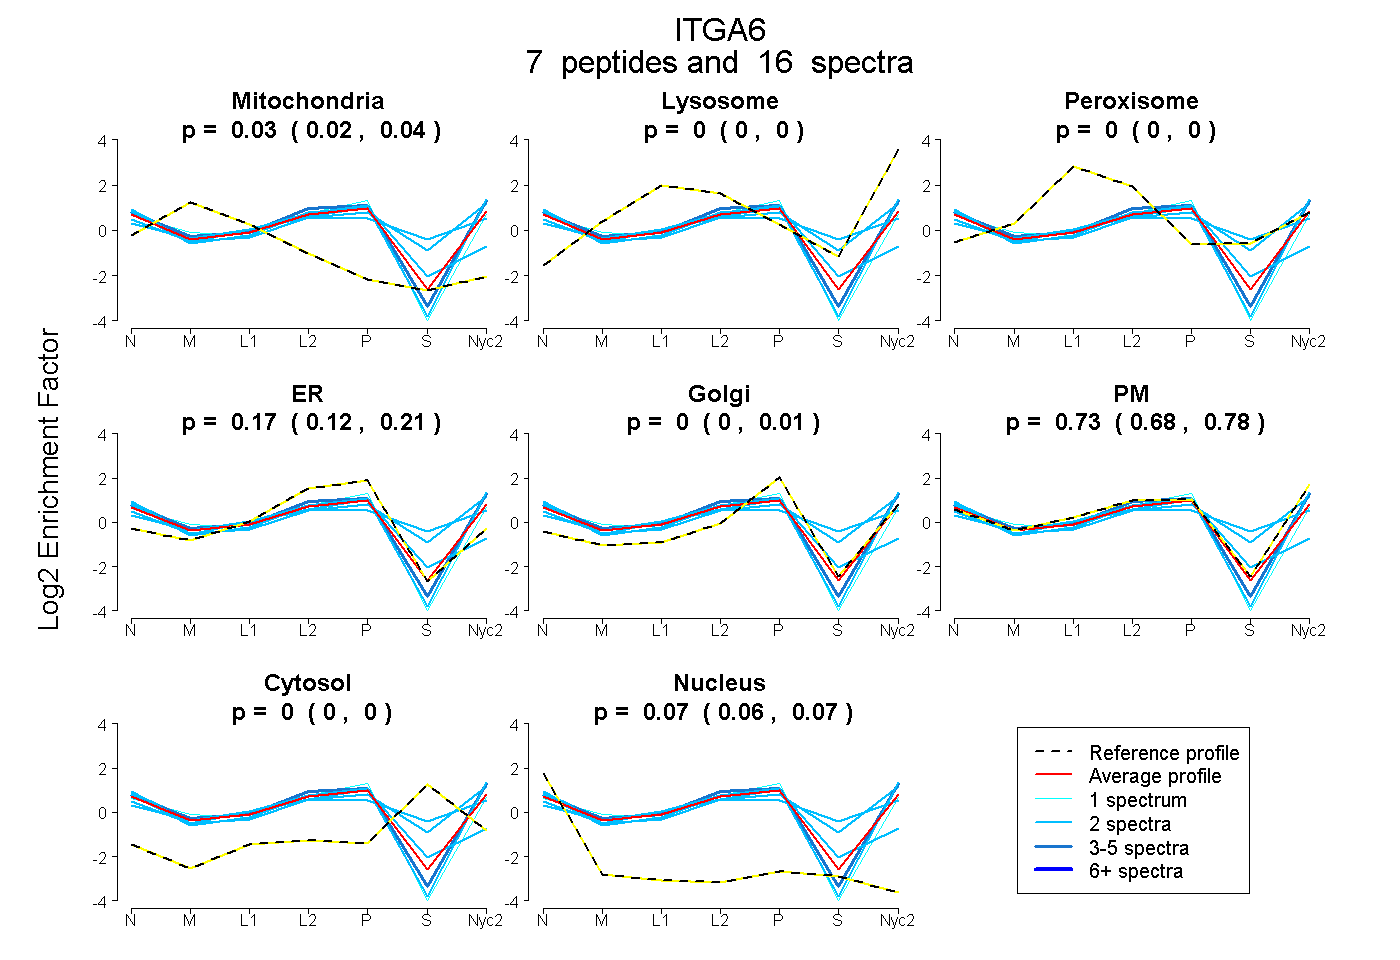
0.017 | 0.040
0.000 | 0.000
0.000 | 0.000
0.122 | 0.205
0.000 | 0.005
0.679 | 0.778
0.000 | 0.000
0.061 | 0.074
1peptide
spectra
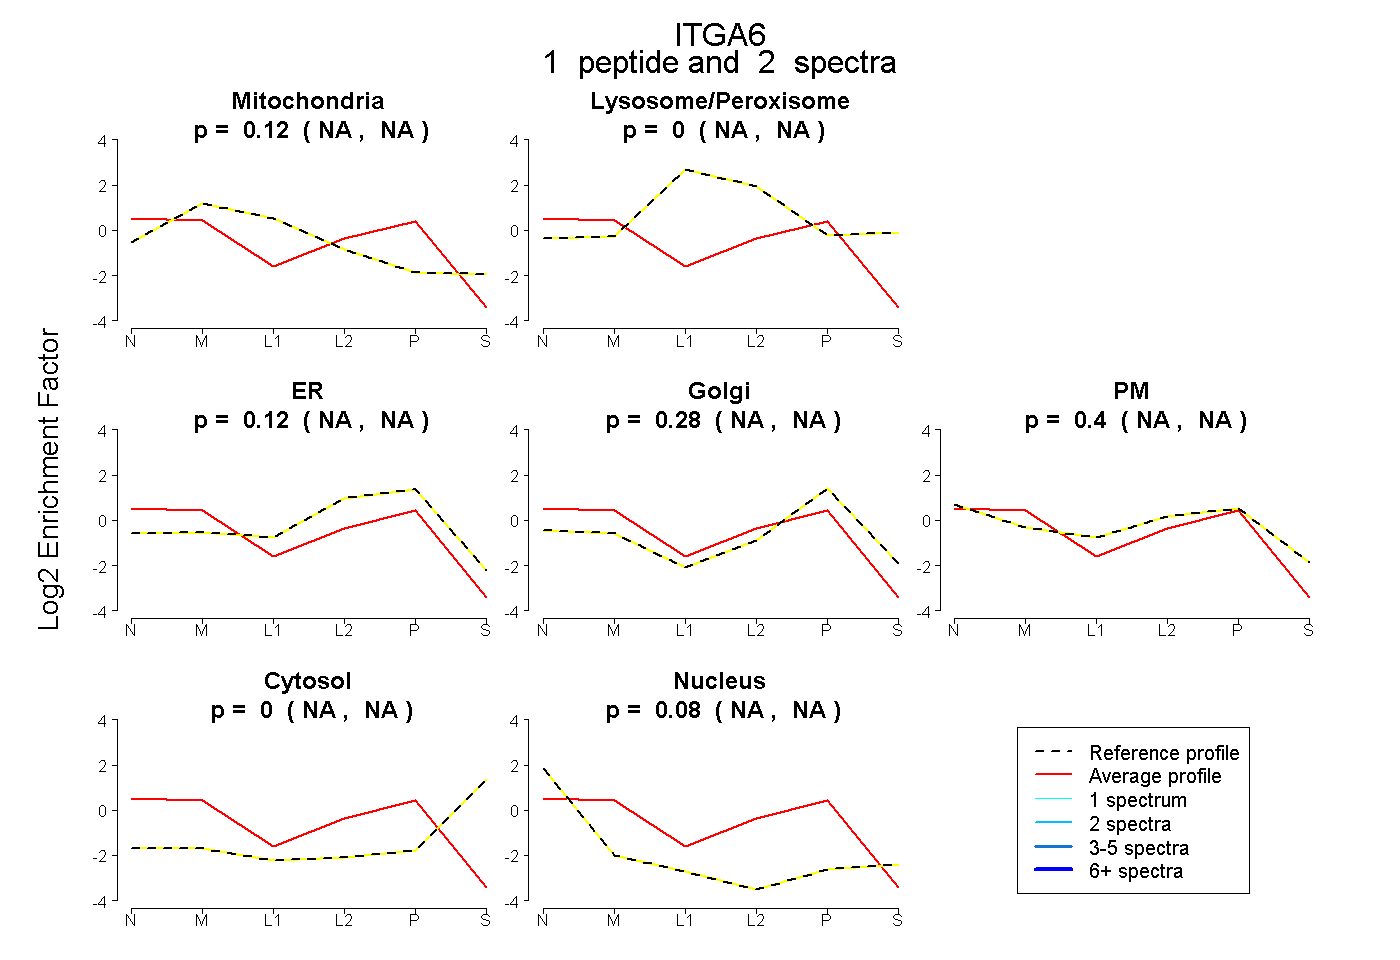
NA | NA
NA | NA
NA | NA
NA | NA
NA | NA
NA | NA
NA | NA
5peptides
spectra
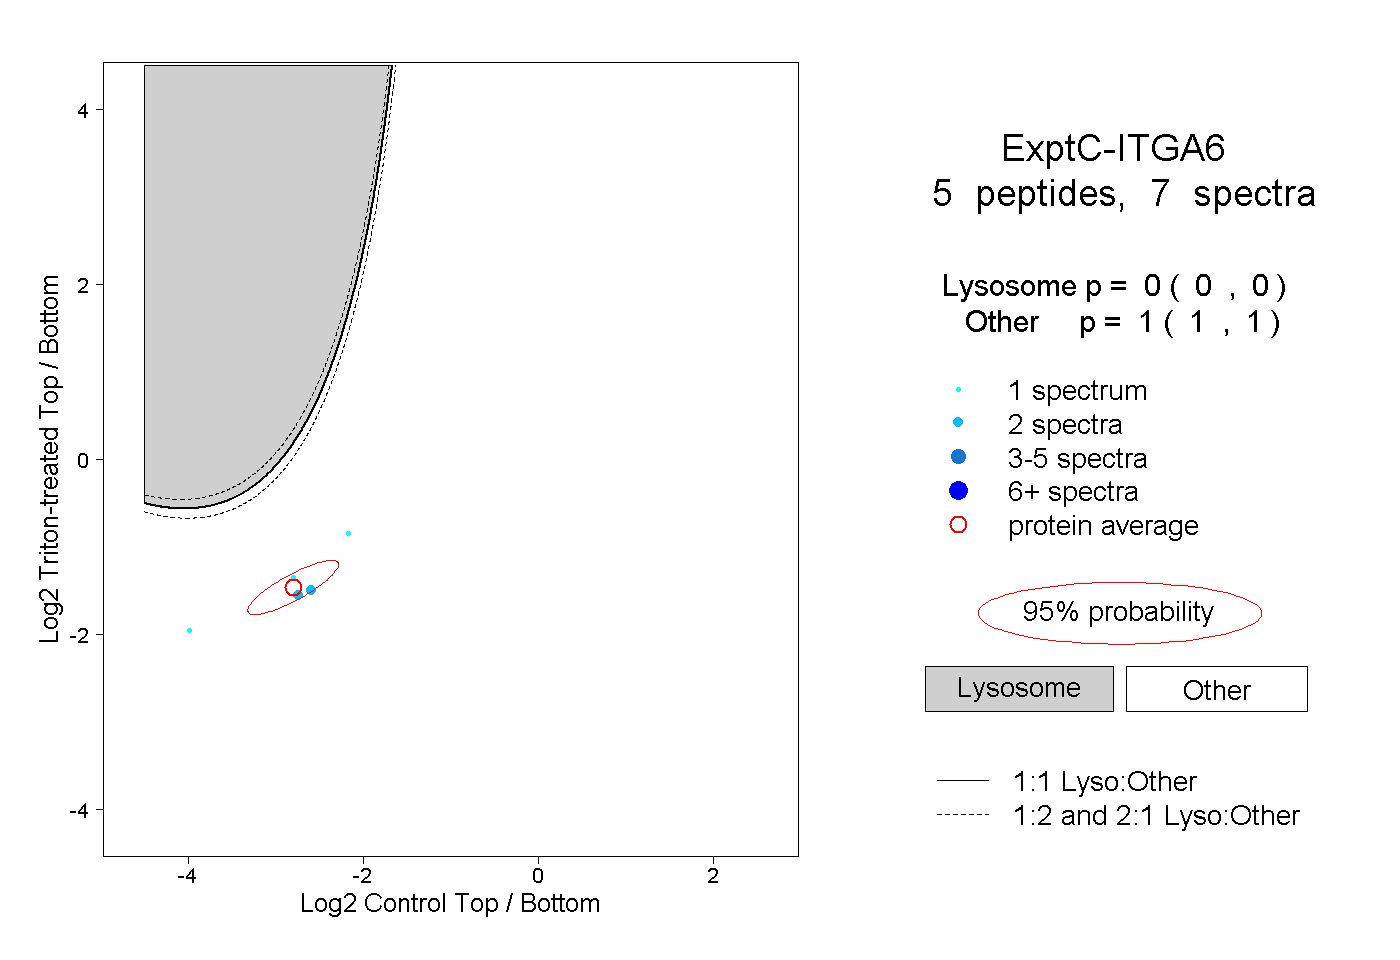
0.000 | 0.000
1.000 | 1.000