 7
7peptides
spectra
0.017 | 0.040
0.000 | 0.000
0.000 | 0.000
0.122 | 0.205
0.000 | 0.005
0.679 | 0.778
0.000 | 0.000
0.061 | 0.074
| Plot | Mito | Lyso | Perox | ER | Golgi | PM | Cytosol | Nucleus | |||||
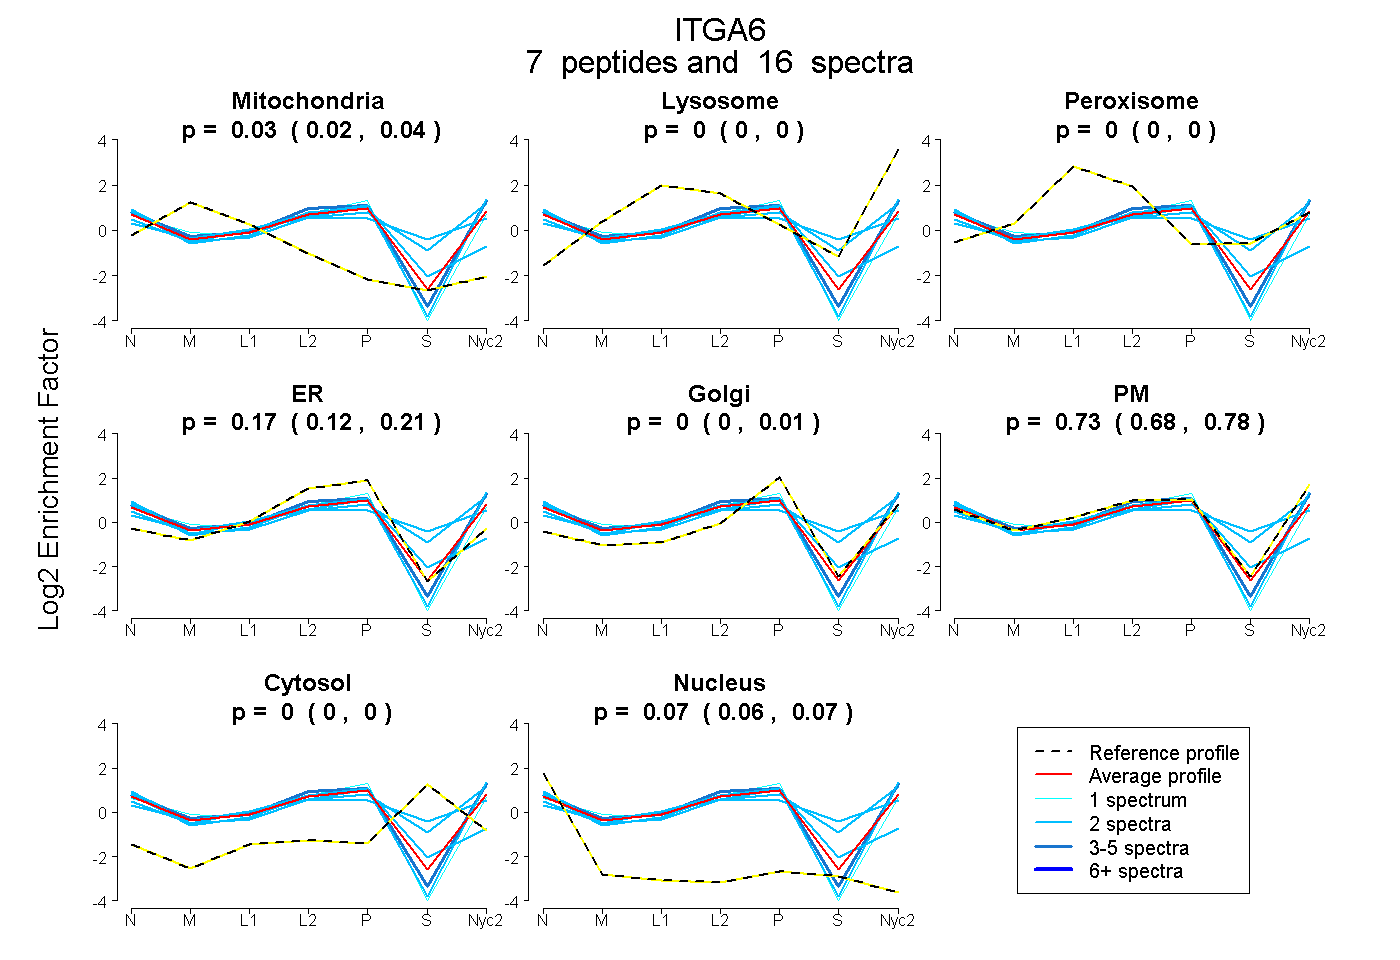
| Expt A |
7 peptides |
16 spectra |
|
0.030 0.017 | 0.040 |
0.000 0.000 | 0.000 |
0.000 0.000 | 0.000 |
0.168 0.122 | 0.205 |
0.000 0.000 | 0.005 |
0.734 0.679 | 0.778 |
0.000 0.000 | 0.000 |
0.069 0.061 | 0.074 |
| 2 spectra, LNYLDILVR | 0.000 | 0.000 | 0.000 | 0.054 | 0.000 | 0.891 | 0.000 | 0.055 | ||
| 2 spectra, VVTCAHR | 0.000 | 0.000 | 0.106 | 0.577 | 0.000 | 0.144 | 0.000 | 0.173 | ||
| 5 spectra, LLLVGAPR | 0.000 | 0.000 | 0.000 | 0.102 | 0.000 | 0.862 | 0.000 | 0.036 | ||
| 2 spectra, GIPELVLK | 0.000 | 0.000 | 0.017 | 0.000 | 0.000 | 0.752 | 0.230 | 0.000 | ||
| 2 spectra, LIATFPDTLTYSAYR | 0.000 | 0.000 | 0.000 | 0.013 | 0.000 | 0.923 | 0.000 | 0.064 | ||
| 2 spectra, YDDSVPR | 0.000 | 0.000 | 0.189 | 0.038 | 0.000 | 0.493 | 0.280 | 0.000 | ||
| 1 spectrum, EGCGDDNVCNSNLK | 0.039 | 0.000 | 0.000 | 0.316 | 0.000 | 0.594 | 0.000 | 0.050 |
| Plot | Mito | Lyso or Perox | ER | Golgi | PM | Cytosol | Nucleus | ||||||
| Expt B |
1 peptide |
2 spectra |
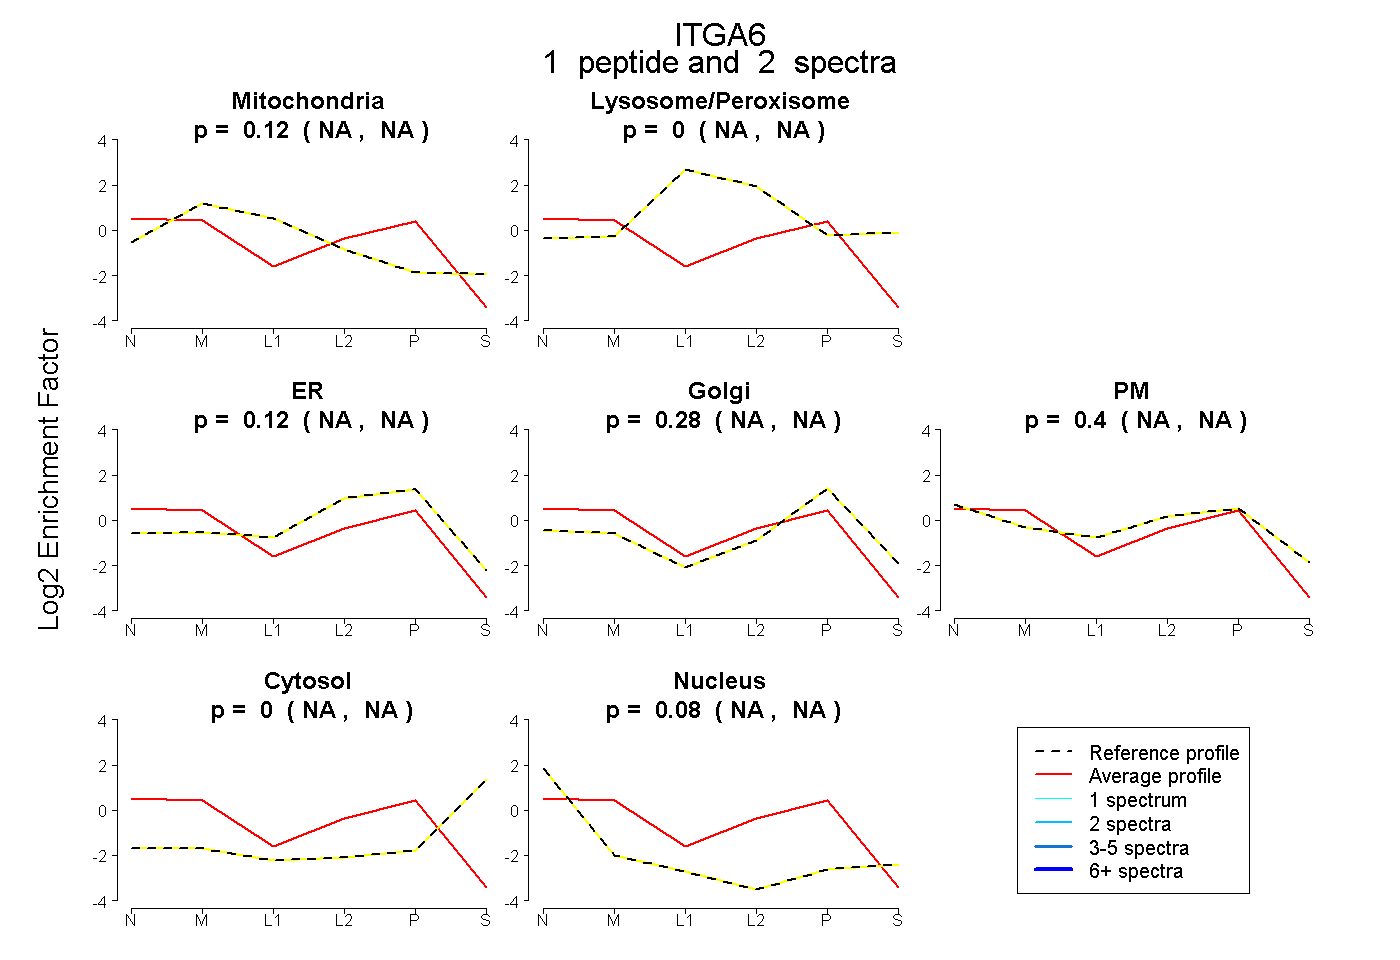 |
0.117 NA | NA |
0.000 NA | NA |
0.118 NA | NA |
0.281 NA | NA |
0.402 NA | NA |
0.000 NA | NA |
0.082 NA | NA |
|||
| Plot | Lyso | Other | |||||||||||
| Expt C |
5 peptides |
7 spectra |
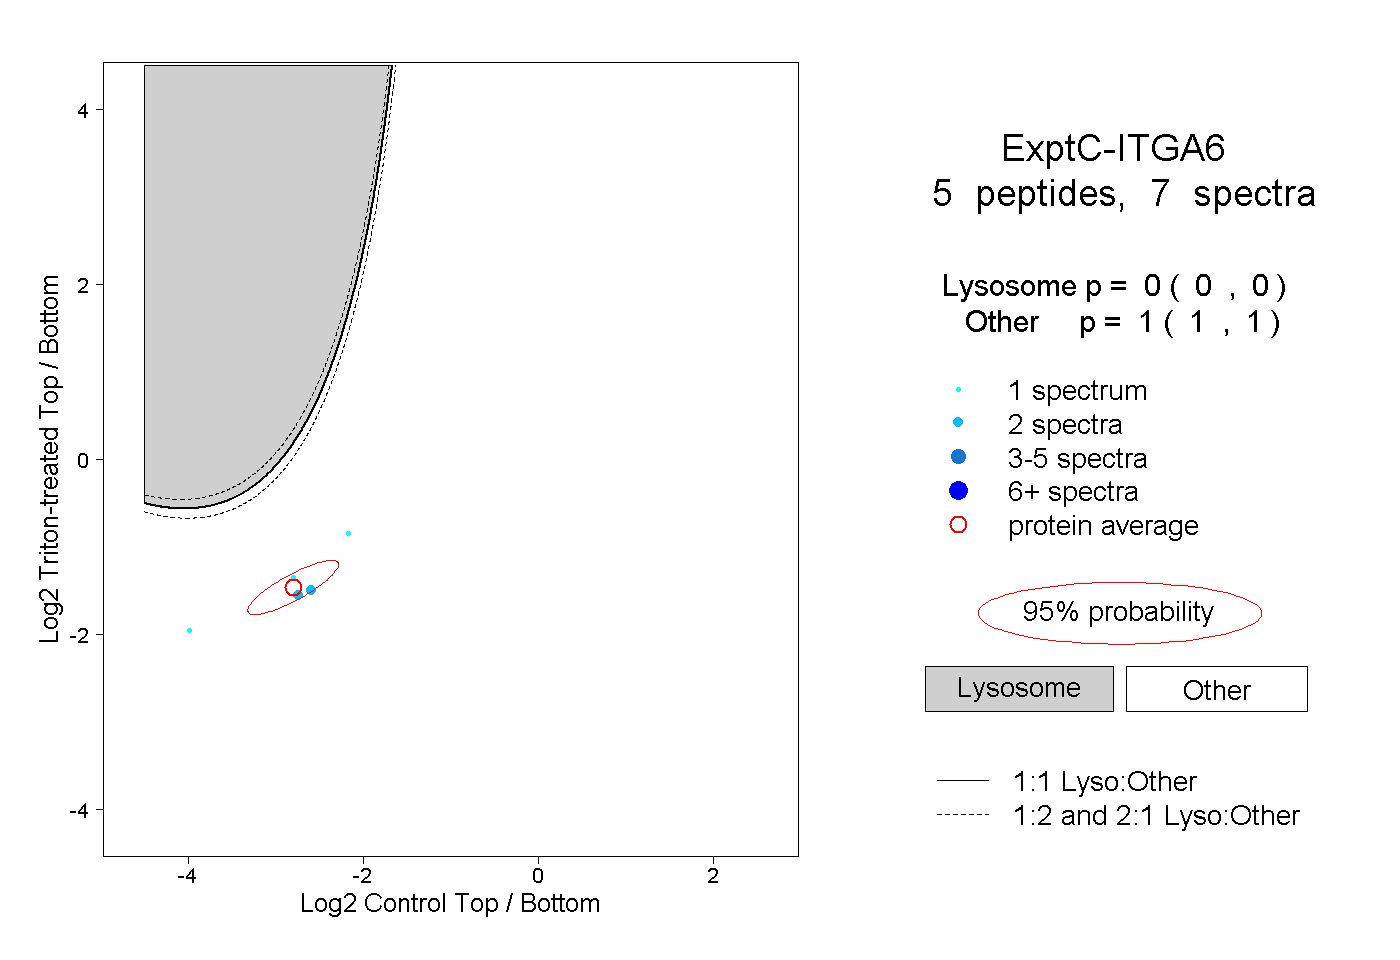 |
0.000 0.000 | 0.000 |
1.000 1.000 | 1.000 |