 5
5peptides
spectra
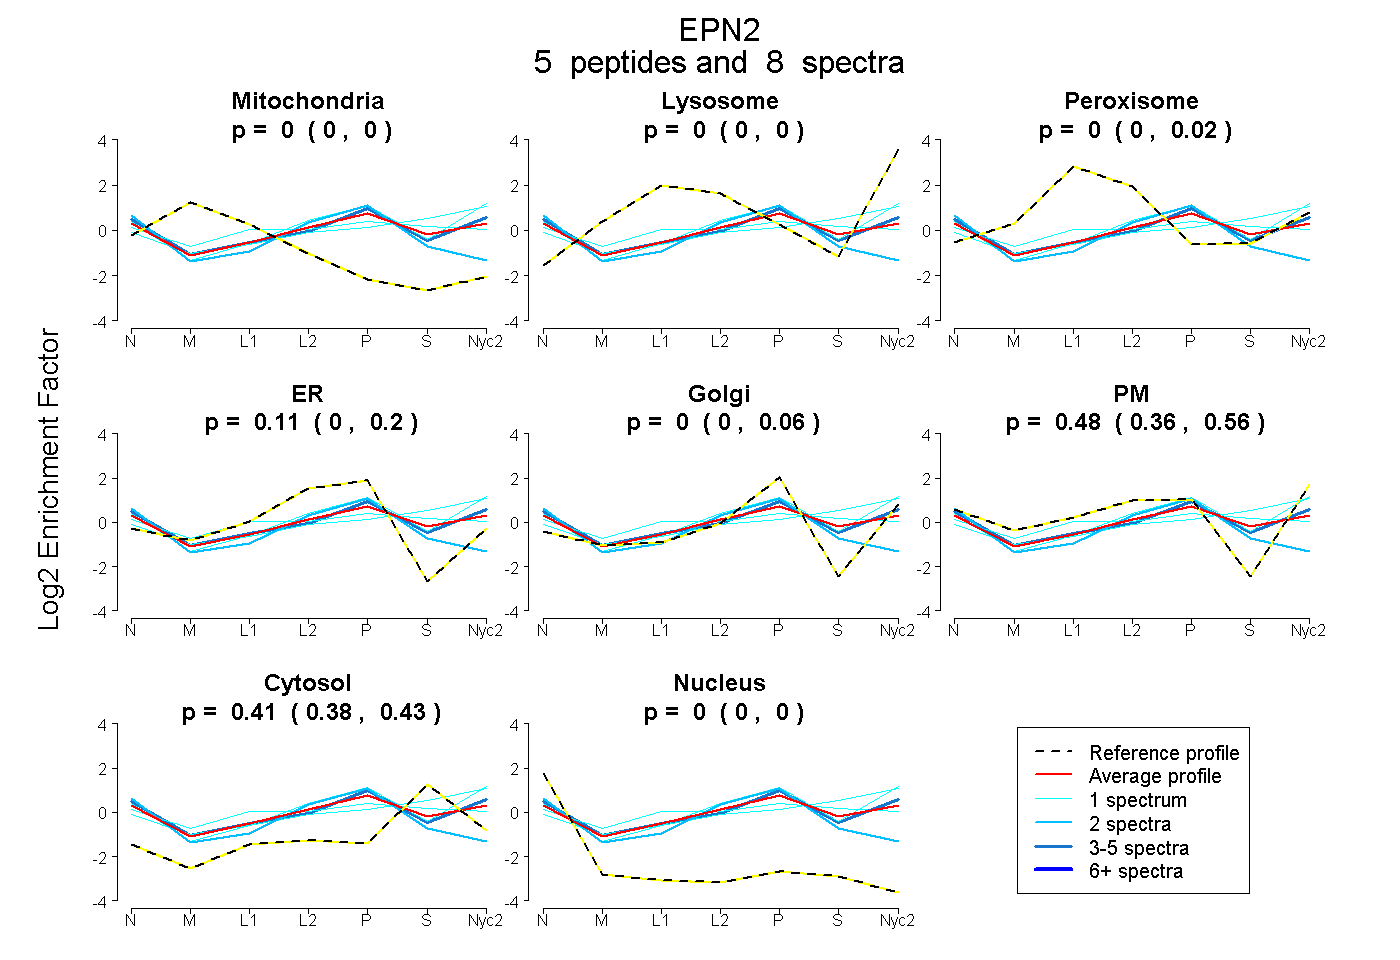
0.000 | 0.000
0.000 | 0.000
0.000 | 0.020
0.000 | 0.196
0.000 | 0.062
0.357 | 0.559
0.384 | 0.431
0.000 | 0.000
1peptide
spectrum
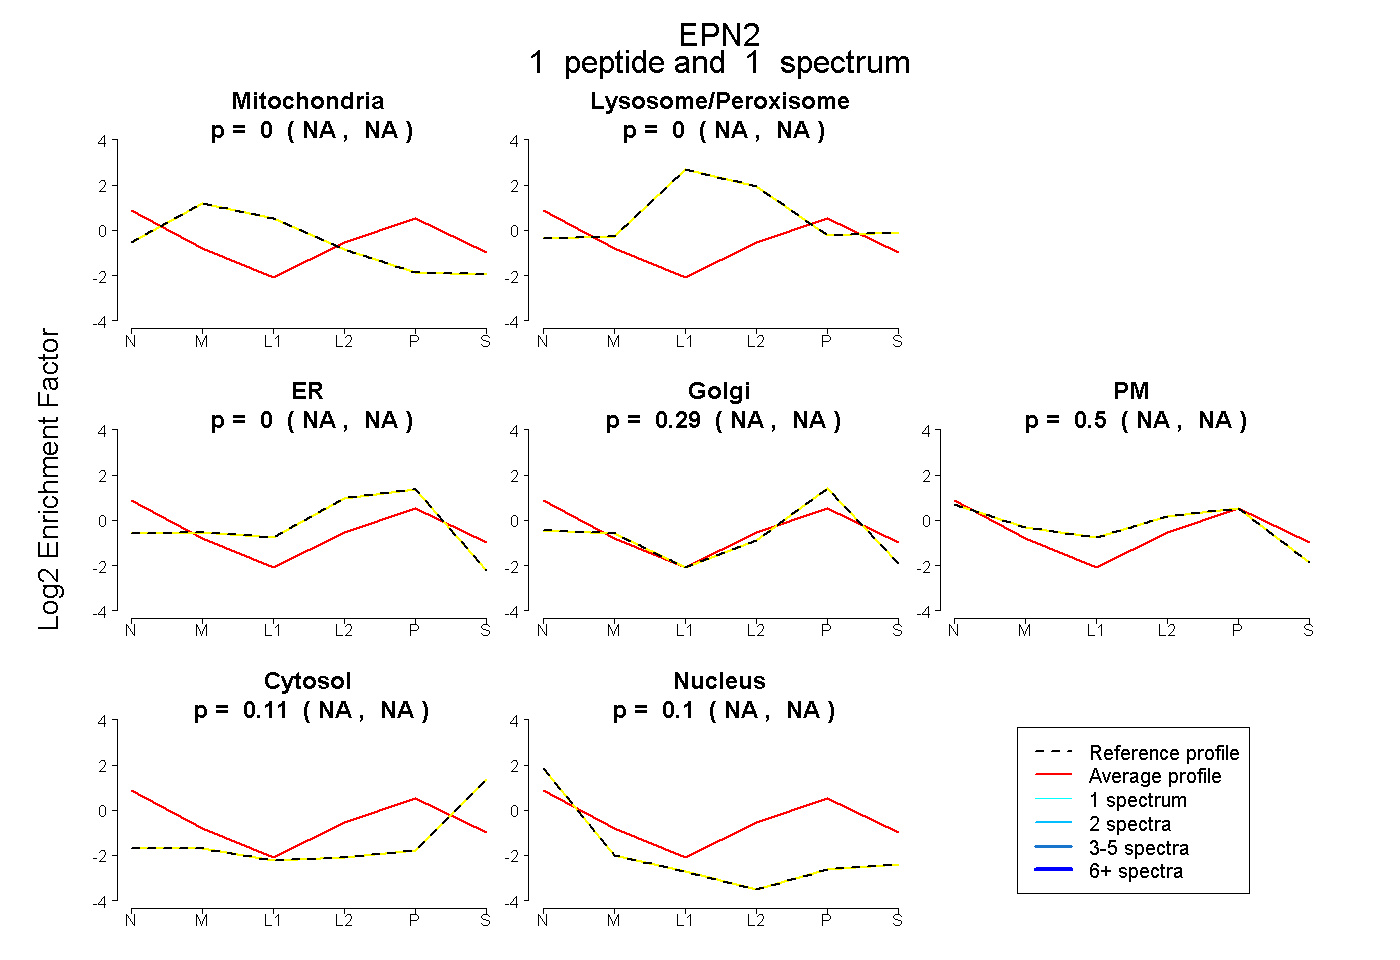
NA | NA
NA | NA
NA | NA
NA | NA
NA | NA
NA | NA
NA | NA
1peptide
spectra
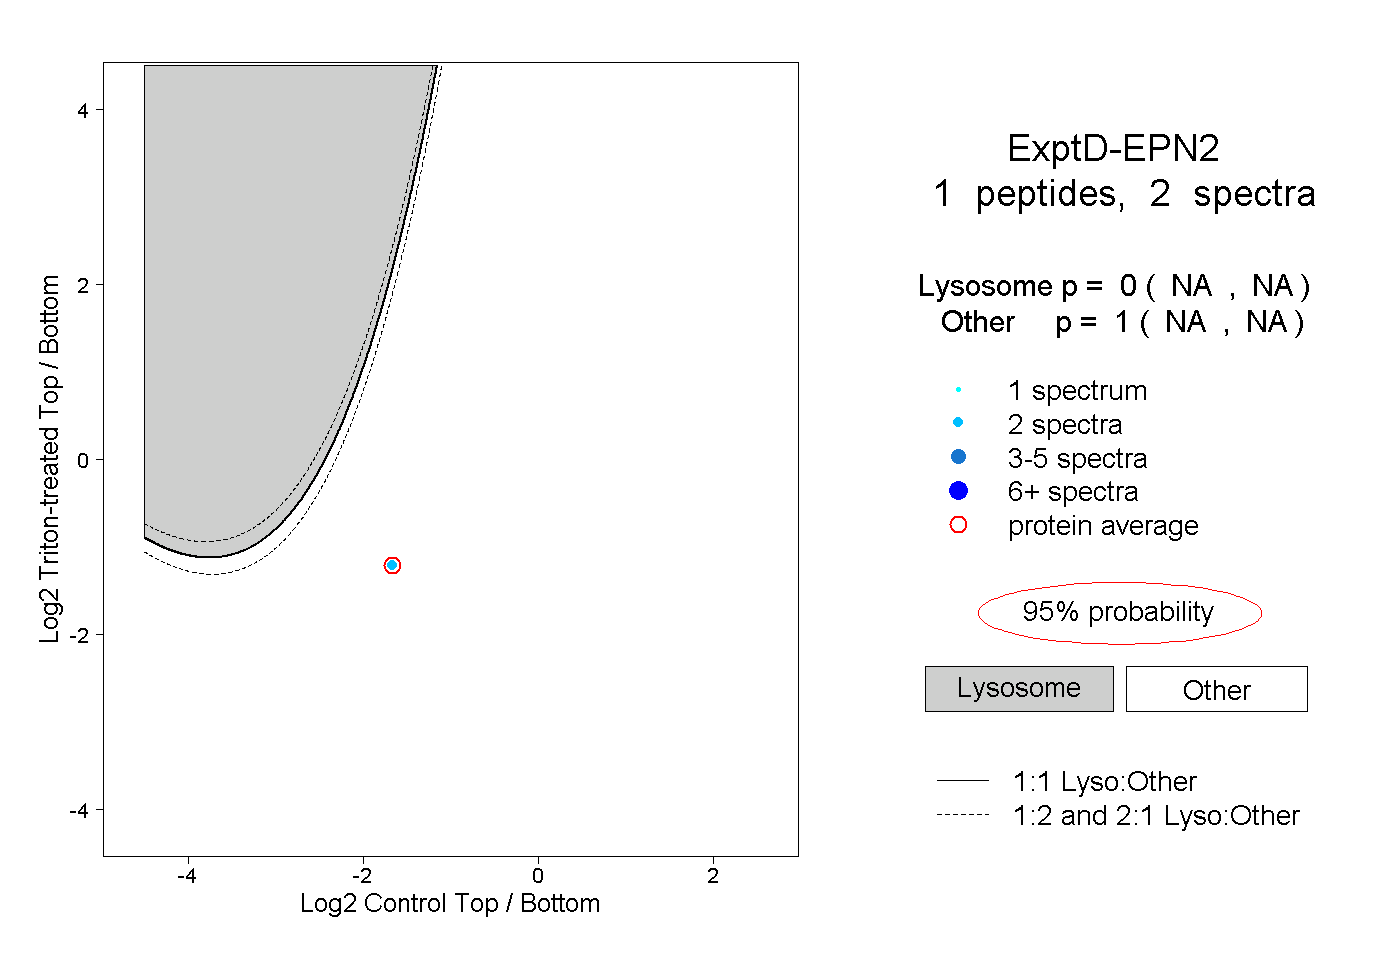
NA | NA
NA | NA