 5
5peptides
spectra
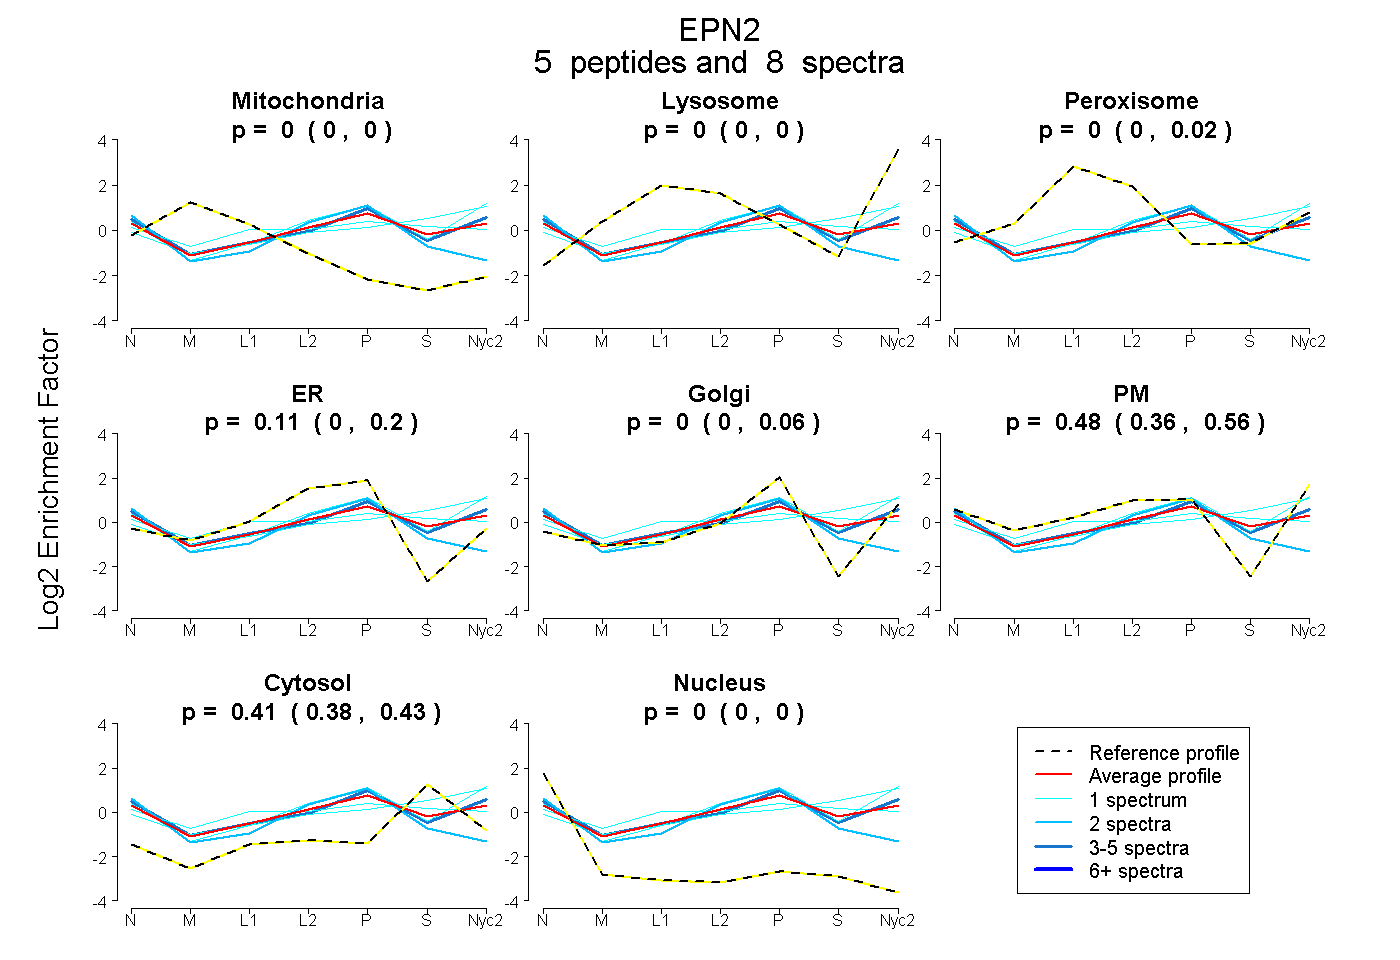
0.000 | 0.000
0.000 | 0.000
0.000 | 0.020
0.000 | 0.196
0.000 | 0.062
0.357 | 0.559
0.384 | 0.431
0.000 | 0.000
| Plot | Mito | Lyso | Perox | ER | Golgi | PM | Cytosol | Nucleus | |||||
| Expt A |
5 peptides |
8 spectra |
|
0.000 0.000 | 0.000 |
0.000 0.000 | 0.000 |
0.000 0.000 | 0.020 |
0.108 0.000 | 0.196 |
0.000 0.000 | 0.062 |
0.479 0.357 | 0.559 |
0.413 0.384 | 0.431 |
0.000 0.000 | 0.000 |
| 1 spectrum, NIVNNYSEAEIK | 0.000 | 0.000 | 0.231 | 0.028 | 0.104 | 0.237 | 0.400 | 0.000 | ||
| 1 spectrum, MAQVATGVGSNQITFGR | 0.000 | 0.145 | 0.000 | 0.000 | 0.000 | 0.355 | 0.500 | 0.000 | ||
| 3 spectra, DFQYIDR | 0.000 | 0.000 | 0.000 | 0.000 | 0.152 | 0.506 | 0.342 | 0.000 | ||
| 2 spectra, VAQQCR | 0.000 | 0.000 | 0.000 | 0.601 | 0.000 | 0.000 | 0.275 | 0.123 | ||
| 1 spectrum, ENIFAIQTLK | 0.000 | 0.000 | 0.000 | 0.000 | 0.099 | 0.595 | 0.306 | 0.000 |
| Plot | Mito | Lyso or Perox | ER | Golgi | PM | Cytosol | Nucleus | ||||||
| Expt B |
1 peptide |
1 spectrum |
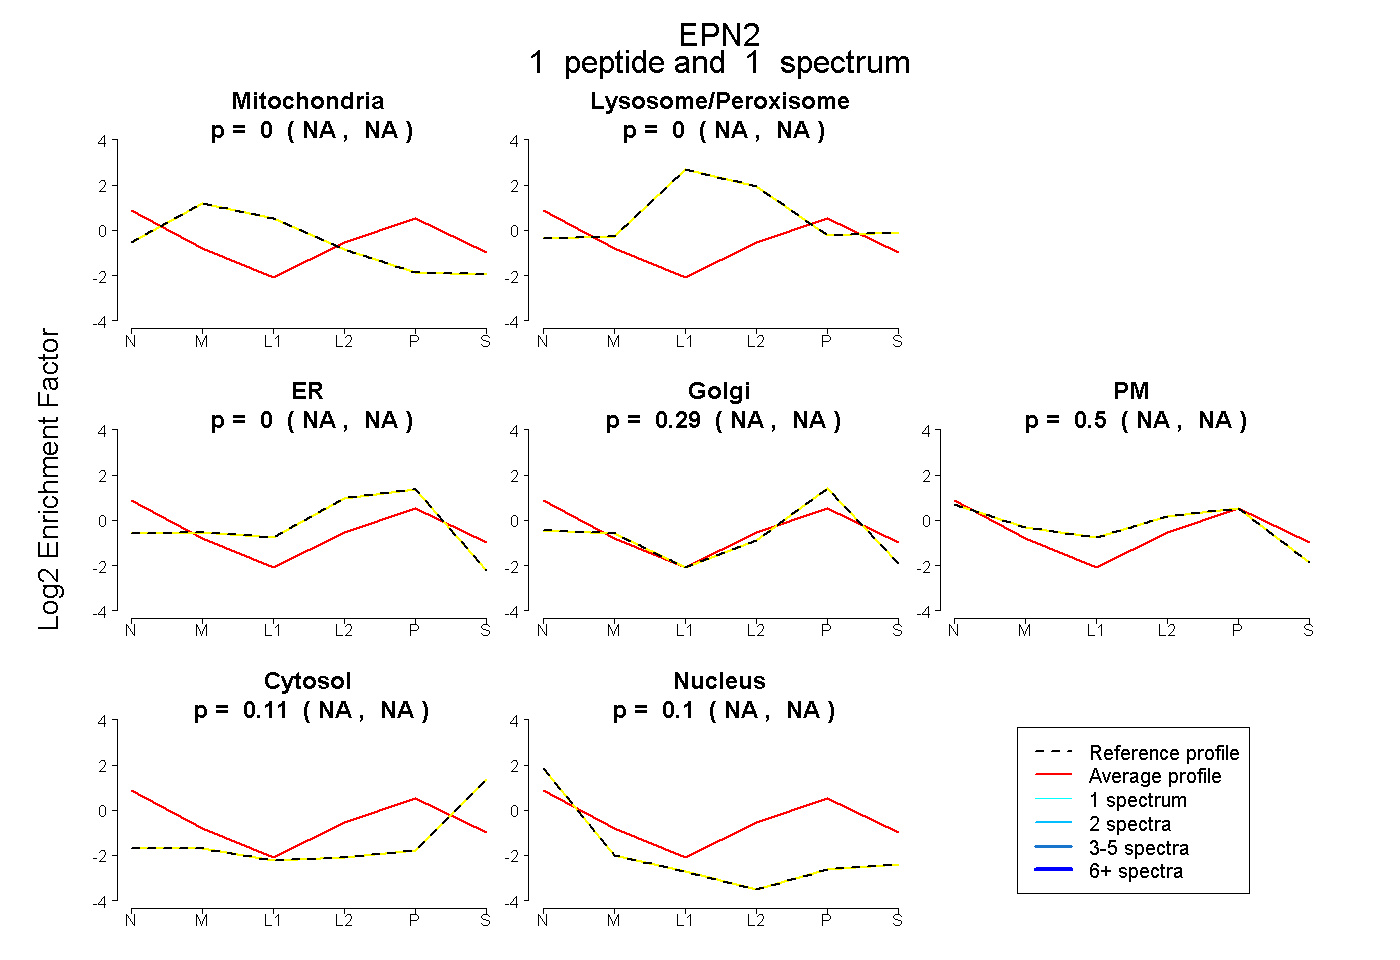 |
0.000 NA | NA |
0.000 NA | NA |
0.000 NA | NA |
0.290 NA | NA |
0.499 NA | NA |
0.115 NA | NA |
0.097 NA | NA |
|||
| Plot | Lyso | Other | |||||||||||
| Expt D |
1 peptide |
2 spectra |
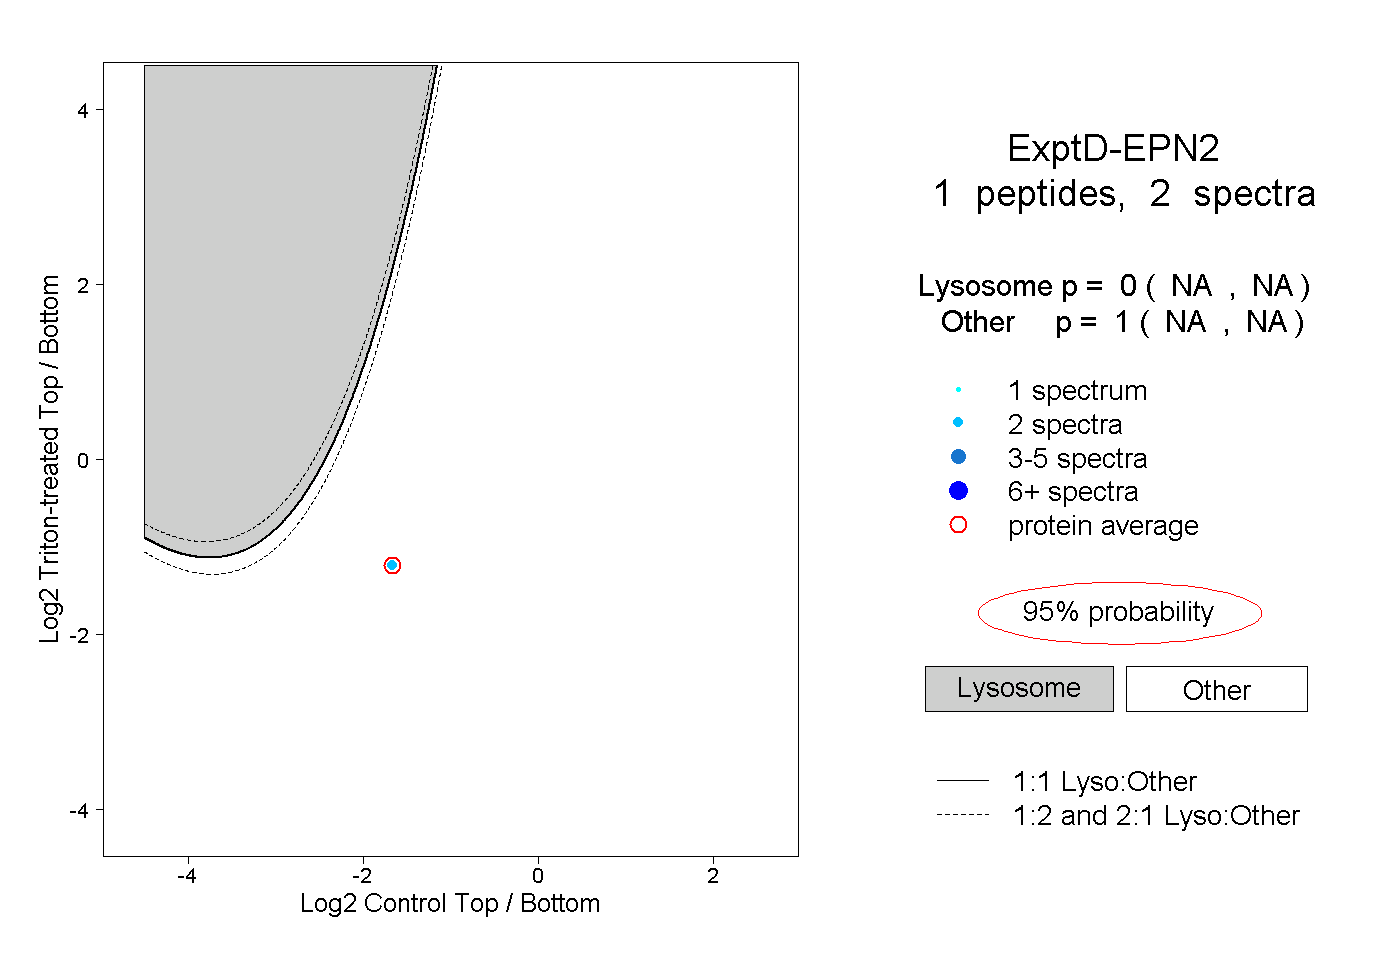 |
0.000 NA | NA |
1.000 NA | NA |