 3
3peptides
spectra
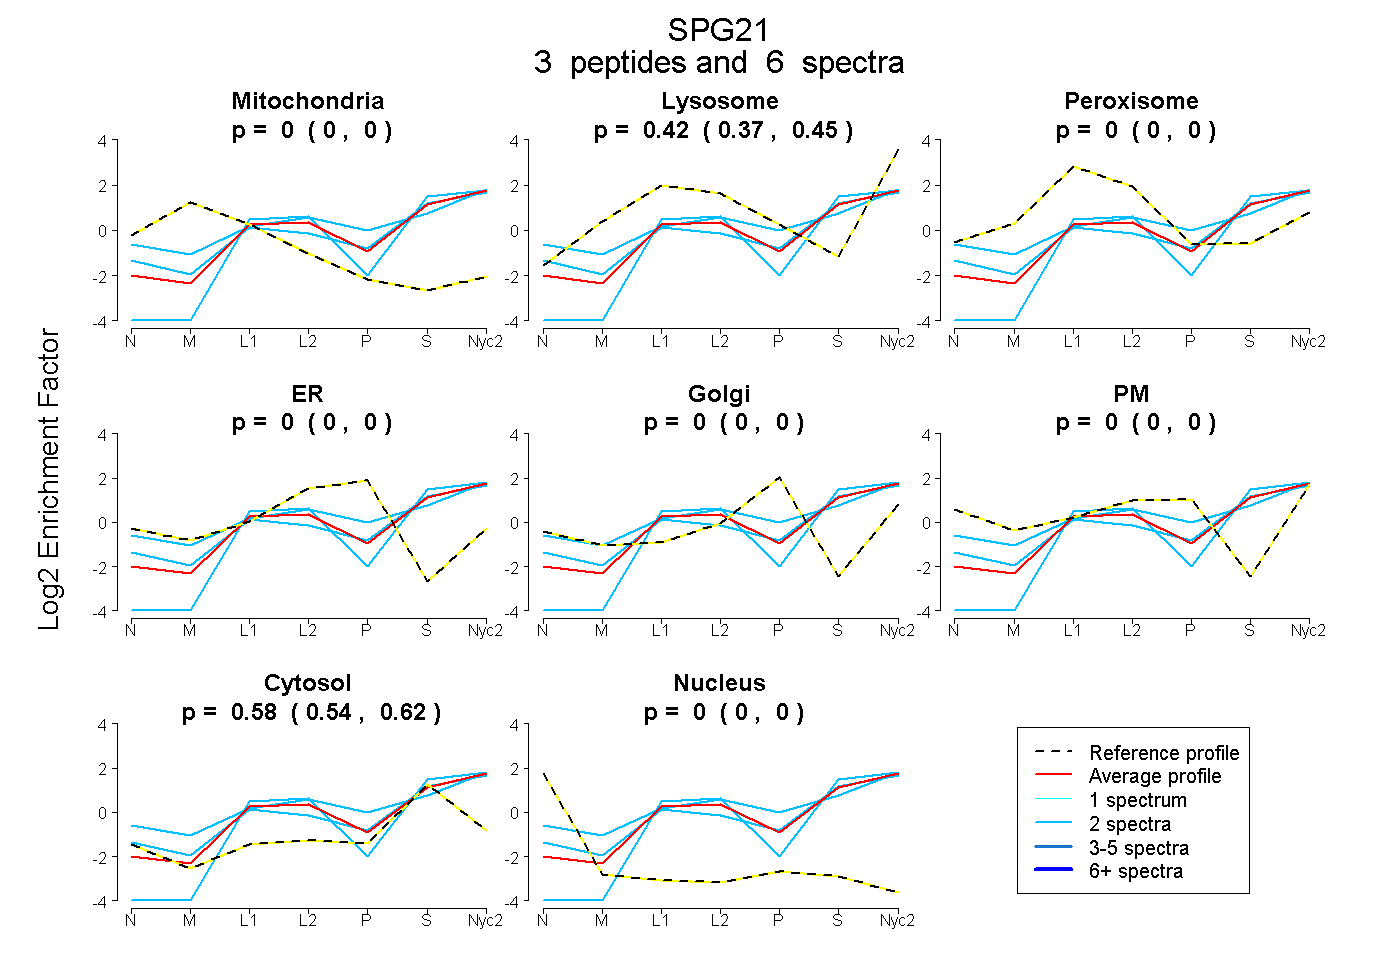
0.000 | 0.000
0.373 | 0.452
0.000 | 0.000
0.000 | 0.000
0.000 | 0.000
0.000 | 0.000
0.540 | 0.621
0.000 | 0.000
8peptides
spectra
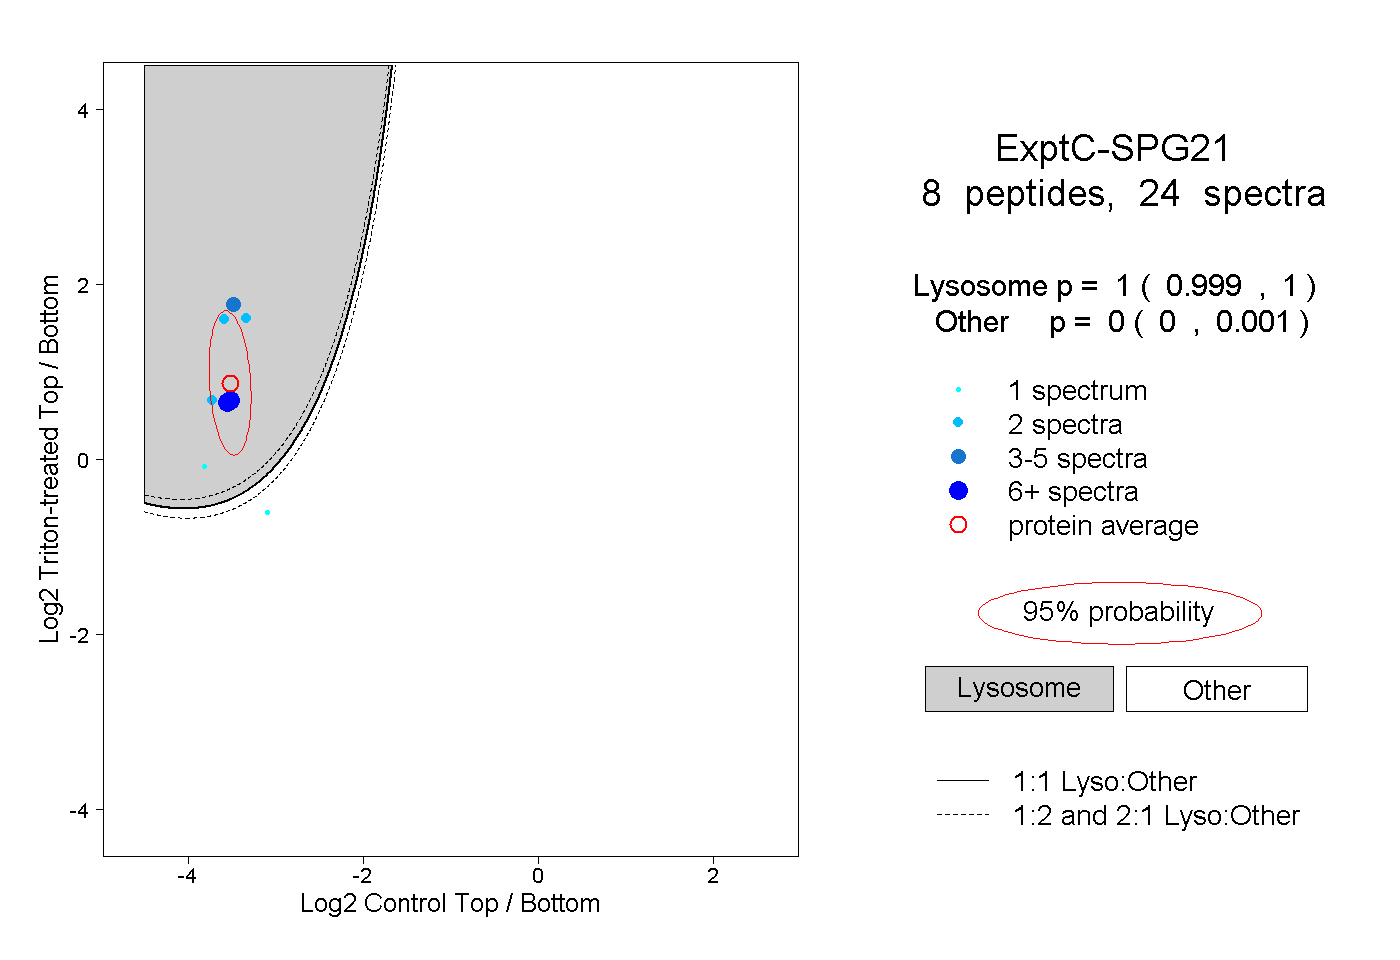
0.999 | 1.000
0.000 | 0.001
1peptide
spectrum
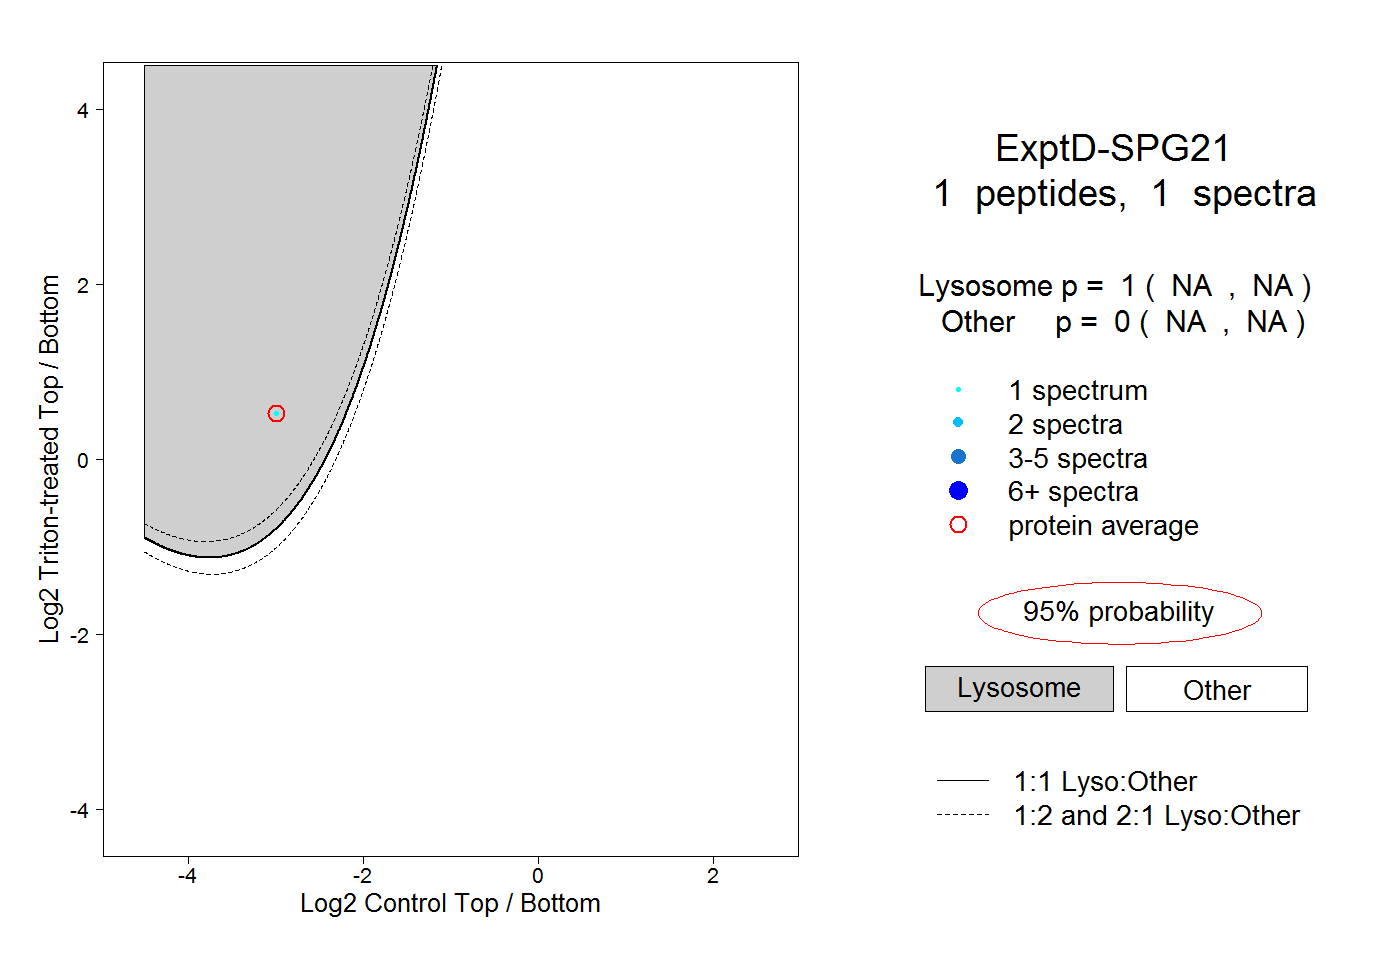
NA | NA
NA | NA