 3
3peptides
spectra
0.000 | 0.000
0.373 | 0.452
0.000 | 0.000
0.000 | 0.000
0.000 | 0.000
0.000 | 0.000
0.540 | 0.621
0.000 | 0.000
| Plot | Mito | Lyso | Perox | ER | Golgi | PM | Cytosol | Nucleus | |||||
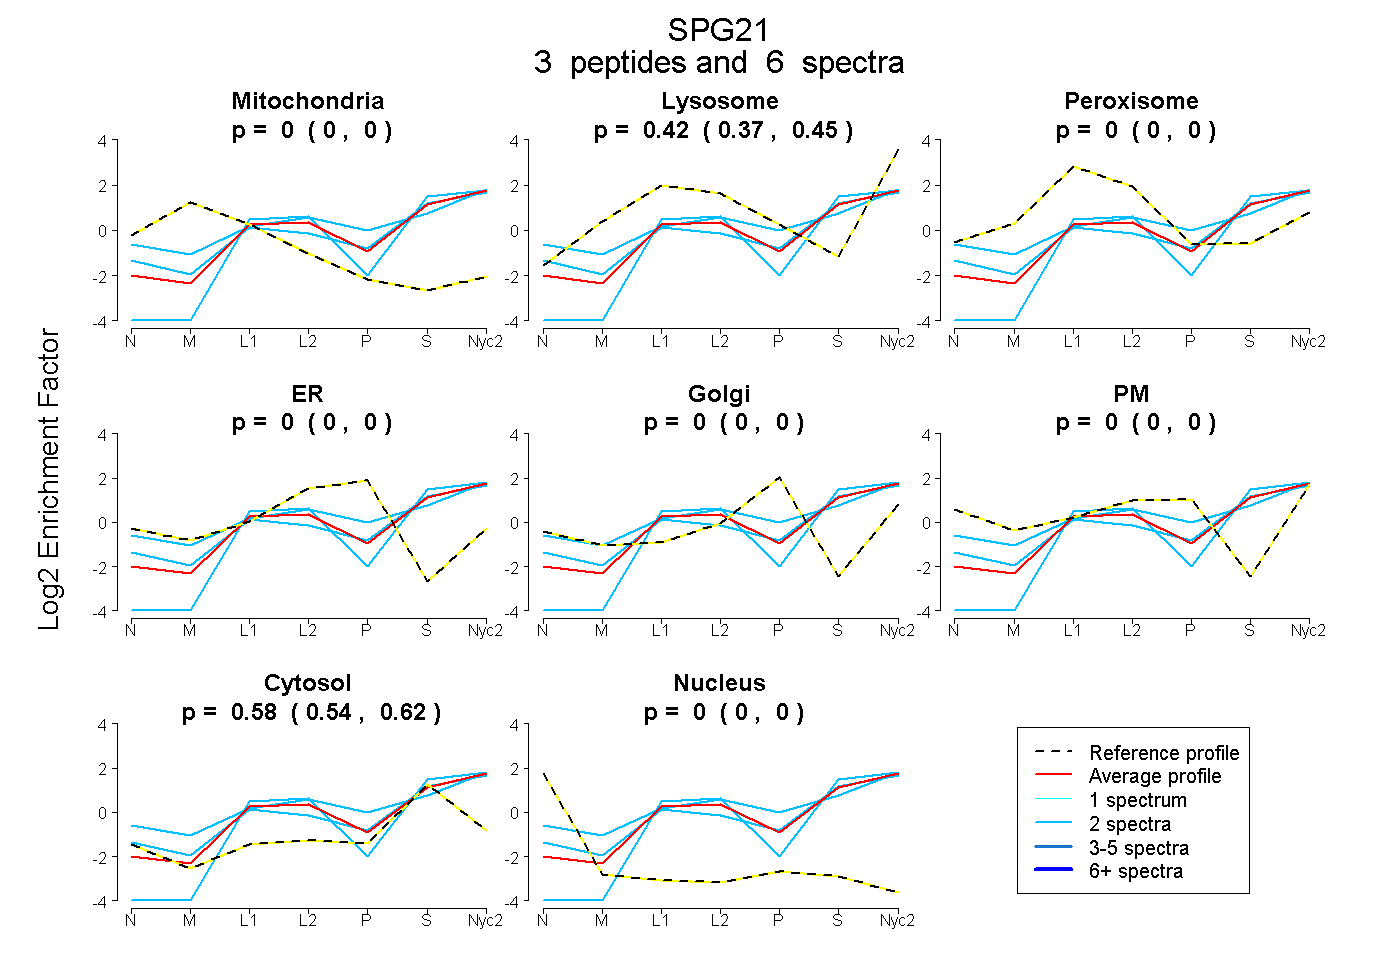
| Expt A |
3 peptides |
6 spectra |
|
0.000 0.000 | 0.000 |
0.417 0.373 | 0.452 |
0.000 0.000 | 0.000 |
0.000 0.000 | 0.000 |
0.000 0.000 | 0.000 |
0.000 0.000 | 0.000 |
0.583 0.540 | 0.621 |
0.000 0.000 | 0.000 |
| 2 spectra, LLDHLQLDK | 0.000 | 0.318 | 0.000 | 0.000 | 0.000 | 0.000 | 0.682 | 0.000 | ||
| 2 spectra, LESLGQSELASR | 0.000 | 0.469 | 0.000 | 0.000 | 0.000 | 0.089 | 0.441 | 0.000 | ||
| 2 spectra, FAEYTHK | 0.000 | 0.398 | 0.000 | 0.000 | 0.000 | 0.000 | 0.602 | 0.000 |
| Plot | Lyso | Other | |||||||||||
| Expt C |
8 peptides |
24 spectra |
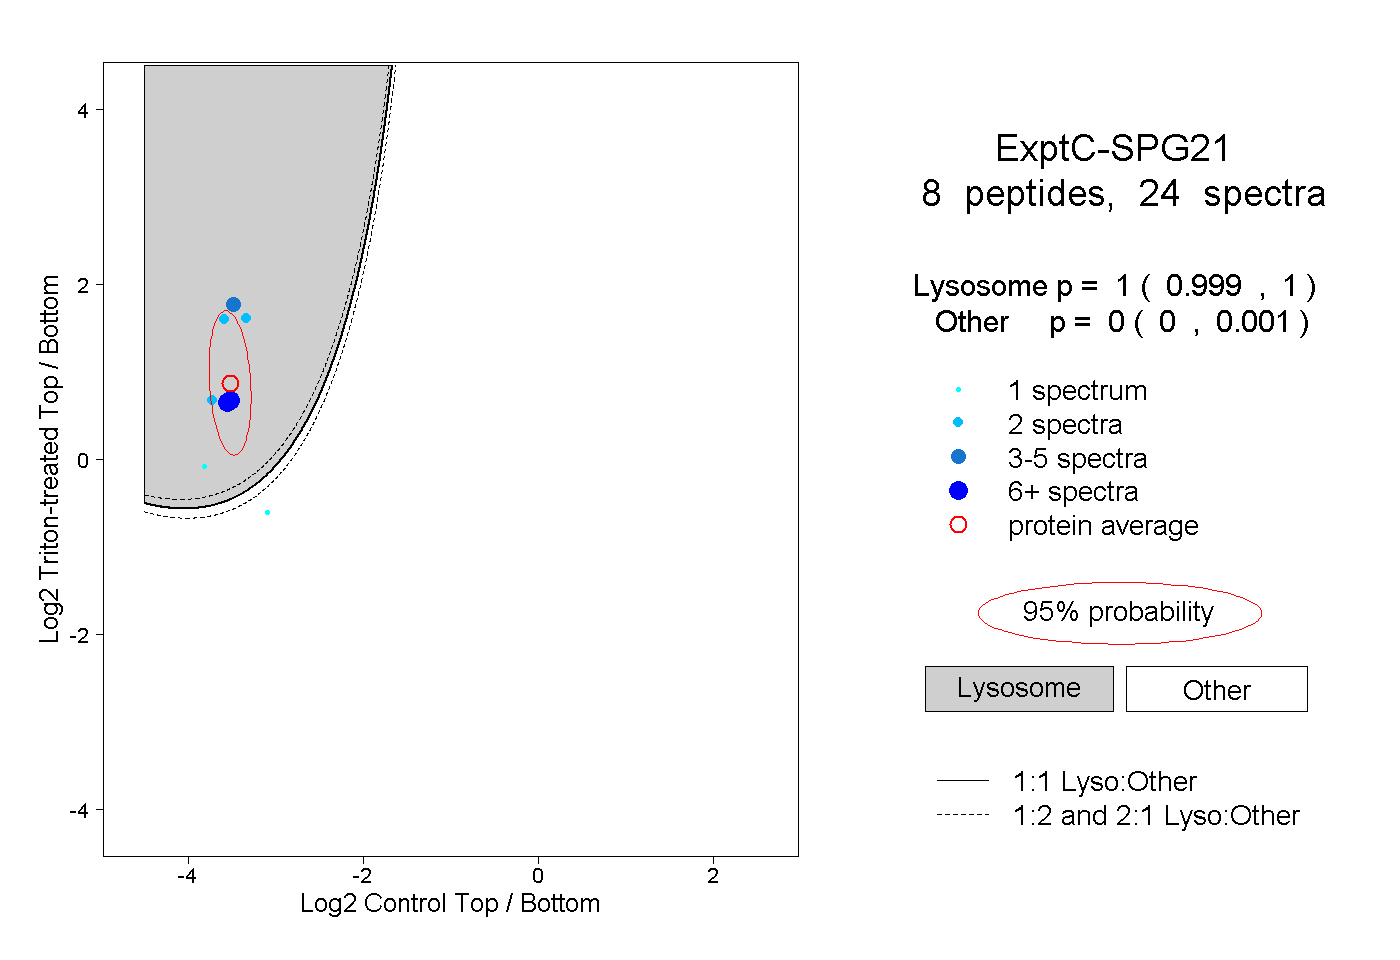 |
1.000 0.999 | 1.000 |
0.000 0.000 | 0.001 |
||||||||
| Plot | Lyso | Other | |||||||||||
| Expt D |
1 peptide |
1 spectrum |
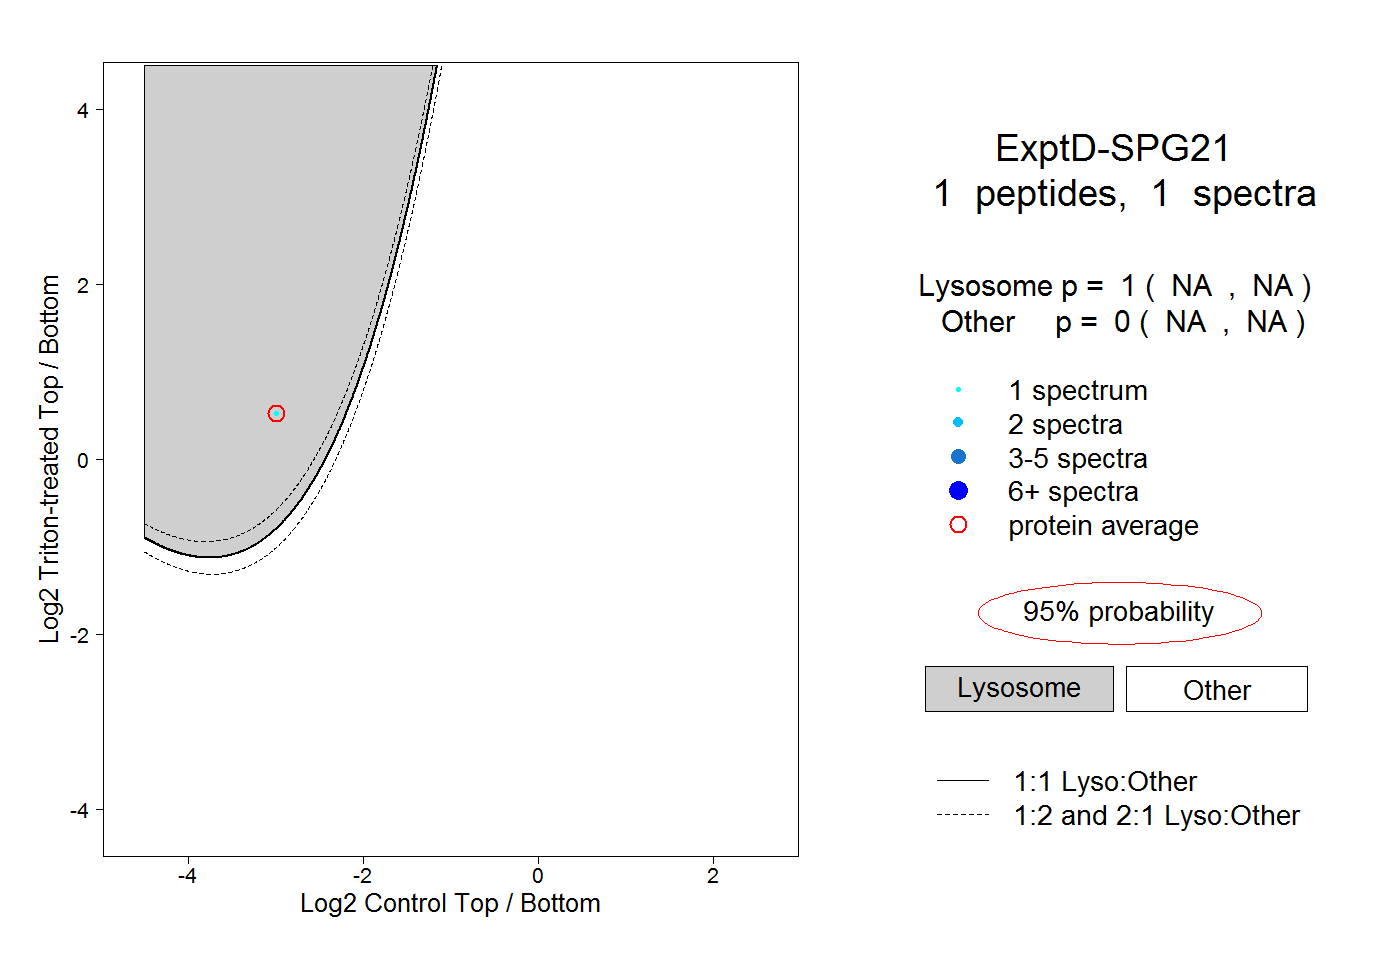 |
1.000 NA | NA |
0.000 NA | NA |