 5
5peptides
spectra
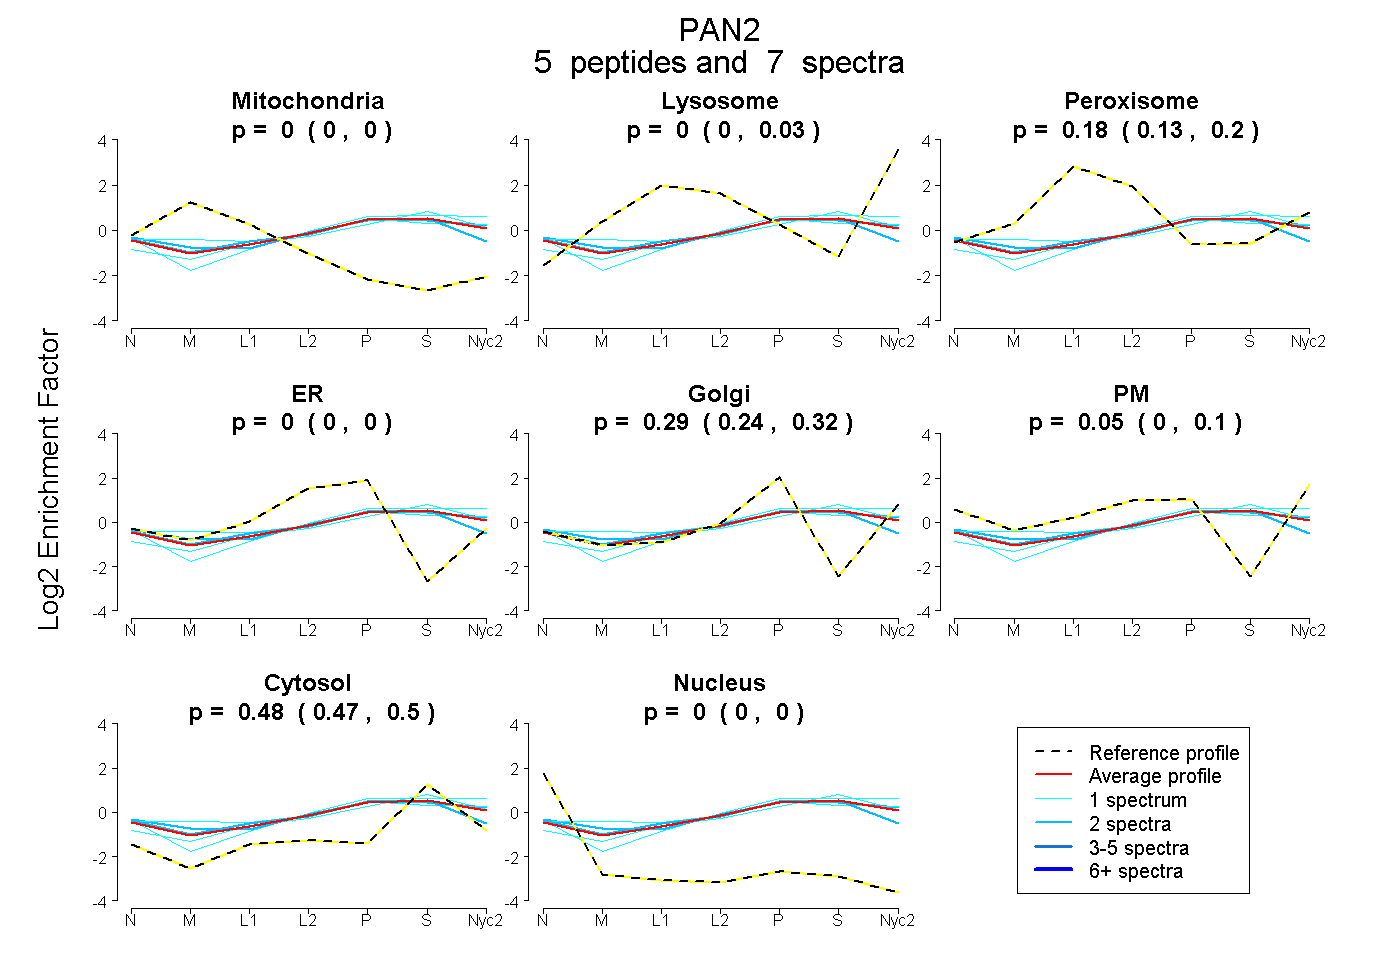
0.000 | 0.000
0.000 | 0.026
0.134 | 0.201
0.000 | 0.000
0.237 | 0.325
0.000 | 0.102
0.465 | 0.497
0.000 | 0.000
1peptide
spectrum
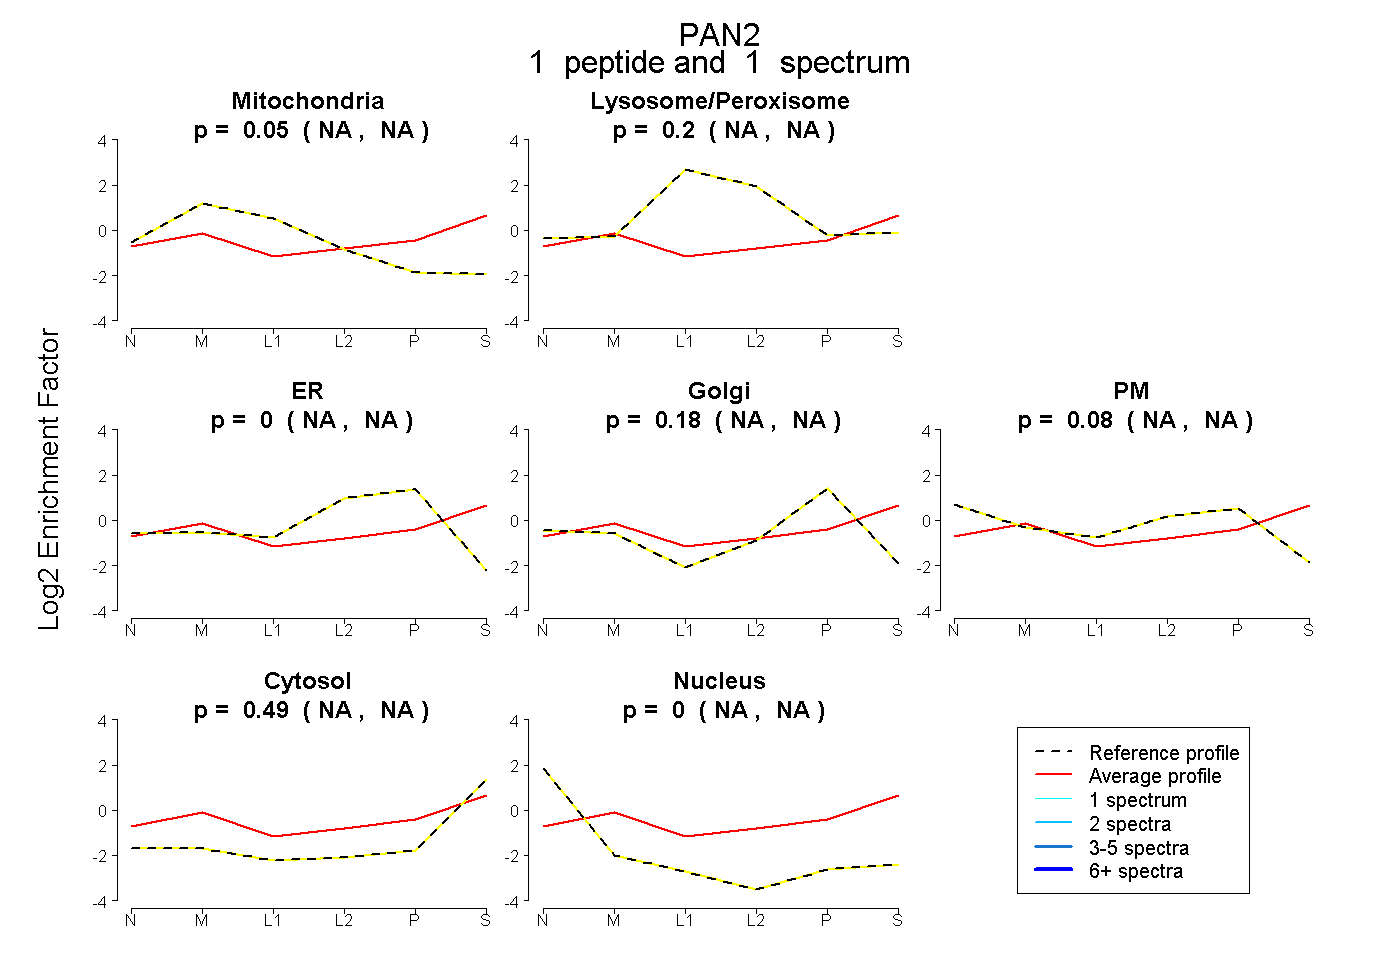
NA | NA
NA | NA
NA | NA
NA | NA
NA | NA
NA | NA
NA | NA
2peptides
spectra
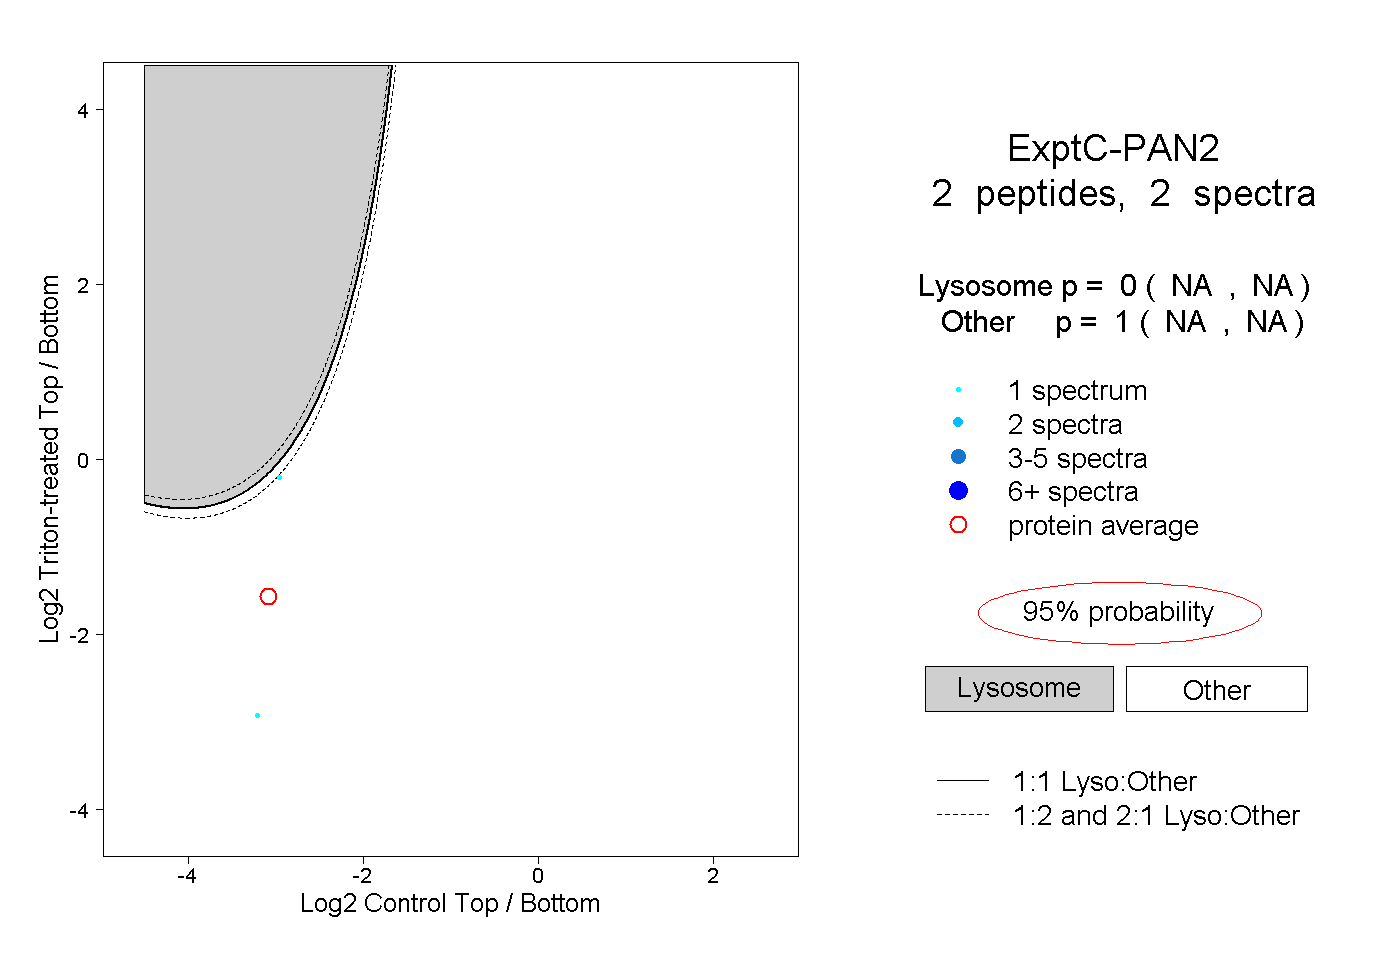
NA | NA
NA | NA