 5
5peptides
spectra
0.000 | 0.000
0.000 | 0.026
0.134 | 0.201
0.000 | 0.000
0.237 | 0.325
0.000 | 0.102
0.465 | 0.497
0.000 | 0.000
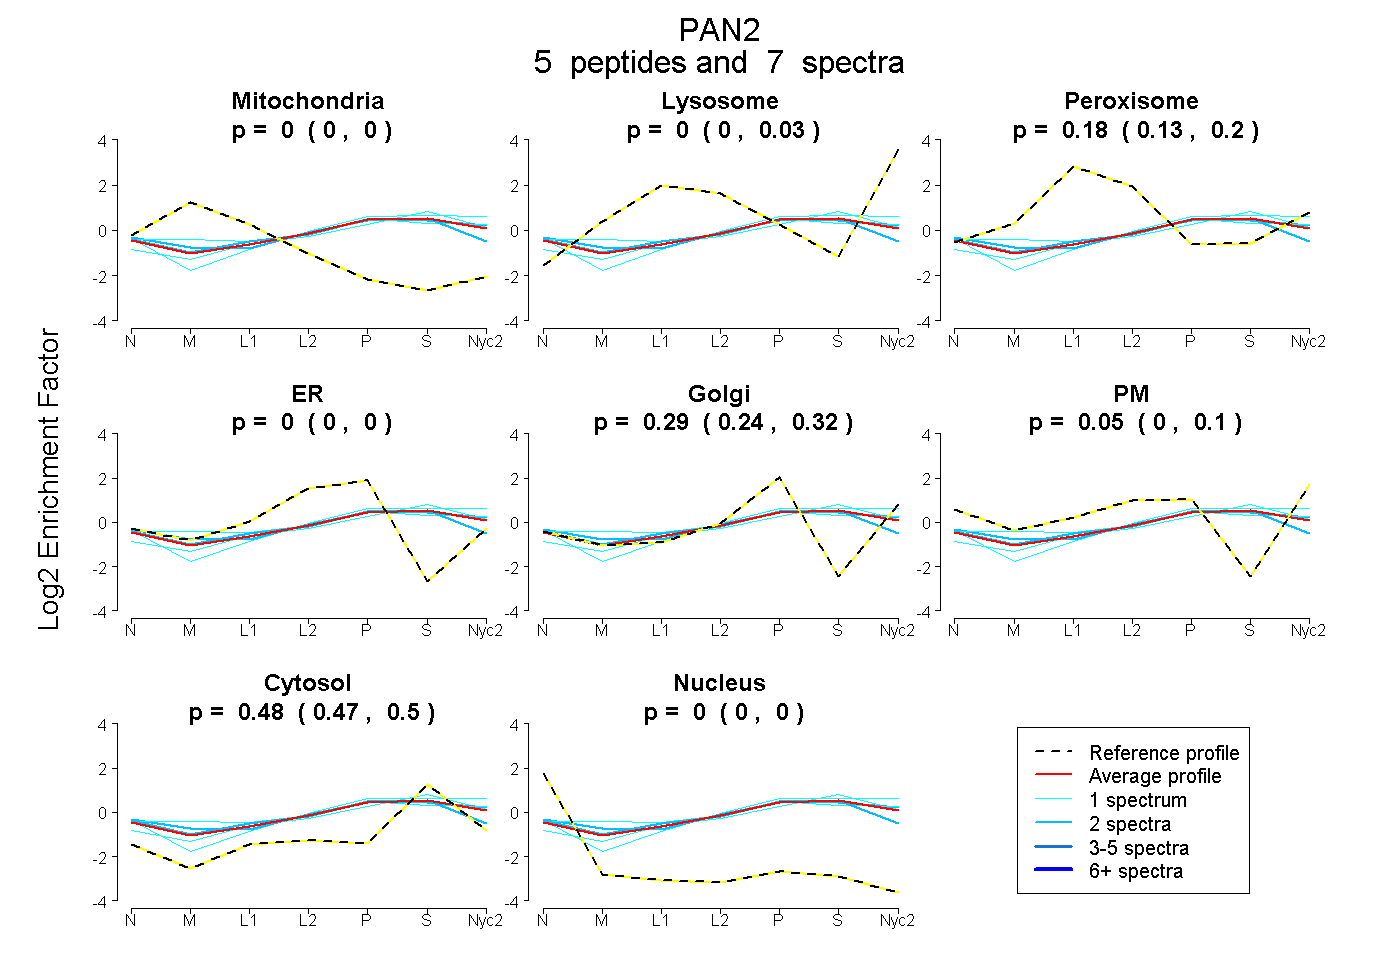
| Plot | Mito | Lyso | Perox | ER | Golgi | PM | Cytosol | Nucleus | |||||
| Expt A |
5 peptides |
7 spectra |
|
0.000 0.000 | 0.000 |
0.000 0.000 | 0.026 |
0.179 0.134 | 0.201 |
0.000 0.000 | 0.000 |
0.288 0.237 | 0.325 |
0.051 0.000 | 0.102 |
0.482 0.465 | 0.497 |
0.000 0.000 | 0.000 |
| 1 spectrum, TIPEASALGLILADSDEASGK | 0.000 | 0.081 | 0.000 | 0.000 | 0.167 | 0.214 | 0.538 | 0.000 | ||
| 2 spectra, VPAILYYVK | 0.000 | 0.000 | 0.126 | 0.000 | 0.199 | 0.201 | 0.474 | 0.000 | ||
| 2 spectra, YQPTIQTR | 0.000 | 0.000 | 0.164 | 0.163 | 0.162 | 0.000 | 0.511 | 0.000 | ||
| 1 spectrum, AITPLQVHVDPAFLR | 0.000 | 0.083 | 0.127 | 0.000 | 0.224 | 0.000 | 0.566 | 0.000 | ||
| 1 spectrum, YNLNIK | 0.000 | 0.014 | 0.224 | 0.000 | 0.310 | 0.055 | 0.396 | 0.000 |
| Plot | Mito | Lyso or Perox | ER | Golgi | PM | Cytosol | Nucleus | ||||||
| Expt B |
1 peptide |
1 spectrum |
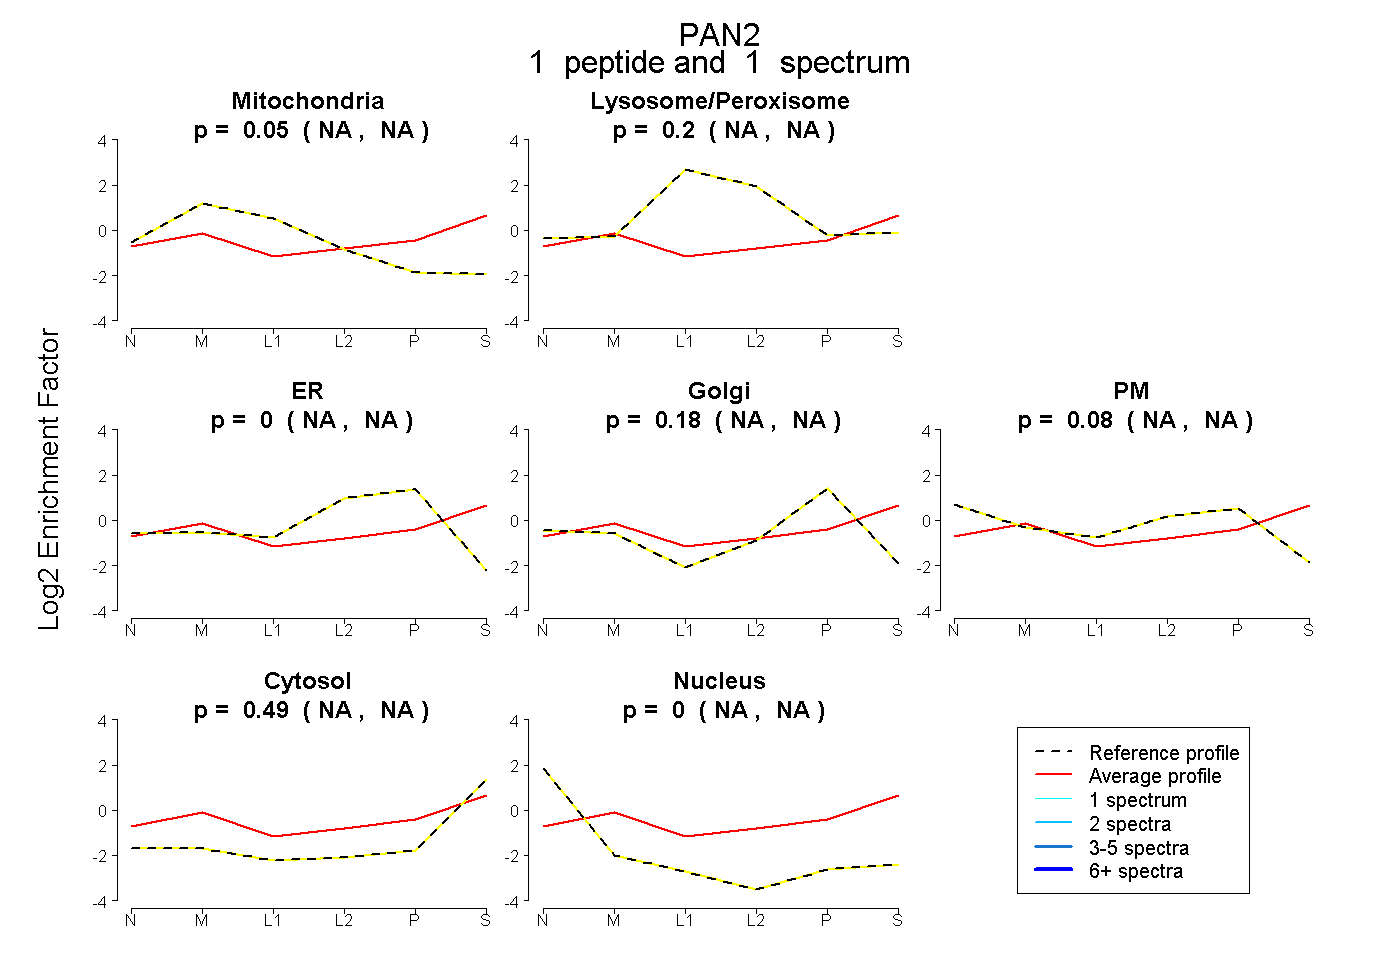 |
0.052 NA | NA |
0.199 NA | NA |
0.000 NA | NA |
0.178 NA | NA |
0.083 NA | NA |
0.489 NA | NA |
0.000 NA | NA |
|||
| Plot | Lyso | Other | |||||||||||
| Expt C |
2 peptides |
2 spectra |
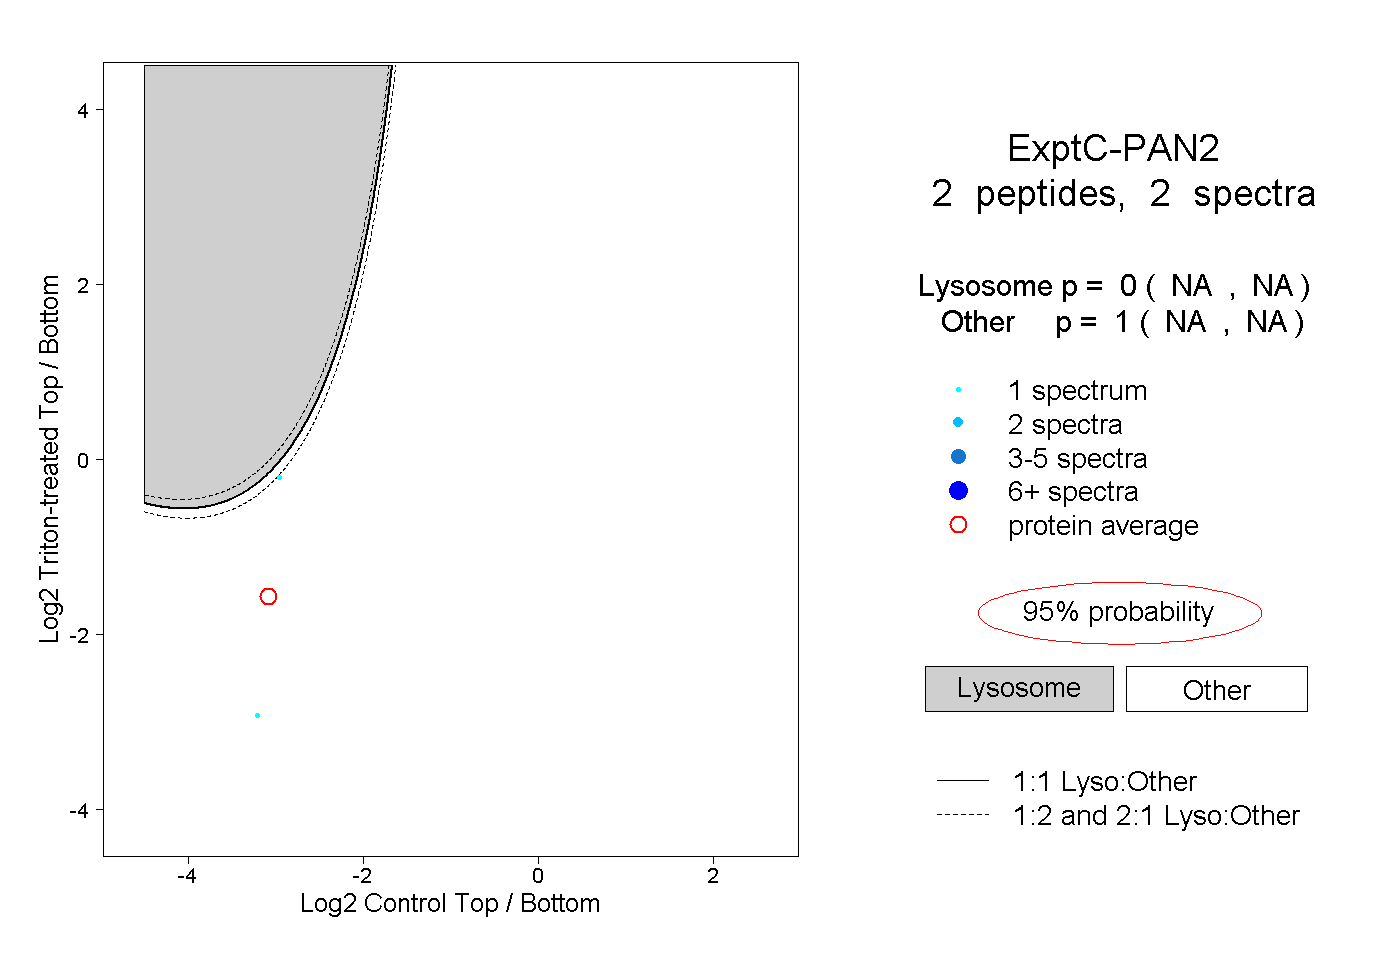 |
0.000 NA | NA |
1.000 NA | NA |