 4
4peptides
spectra
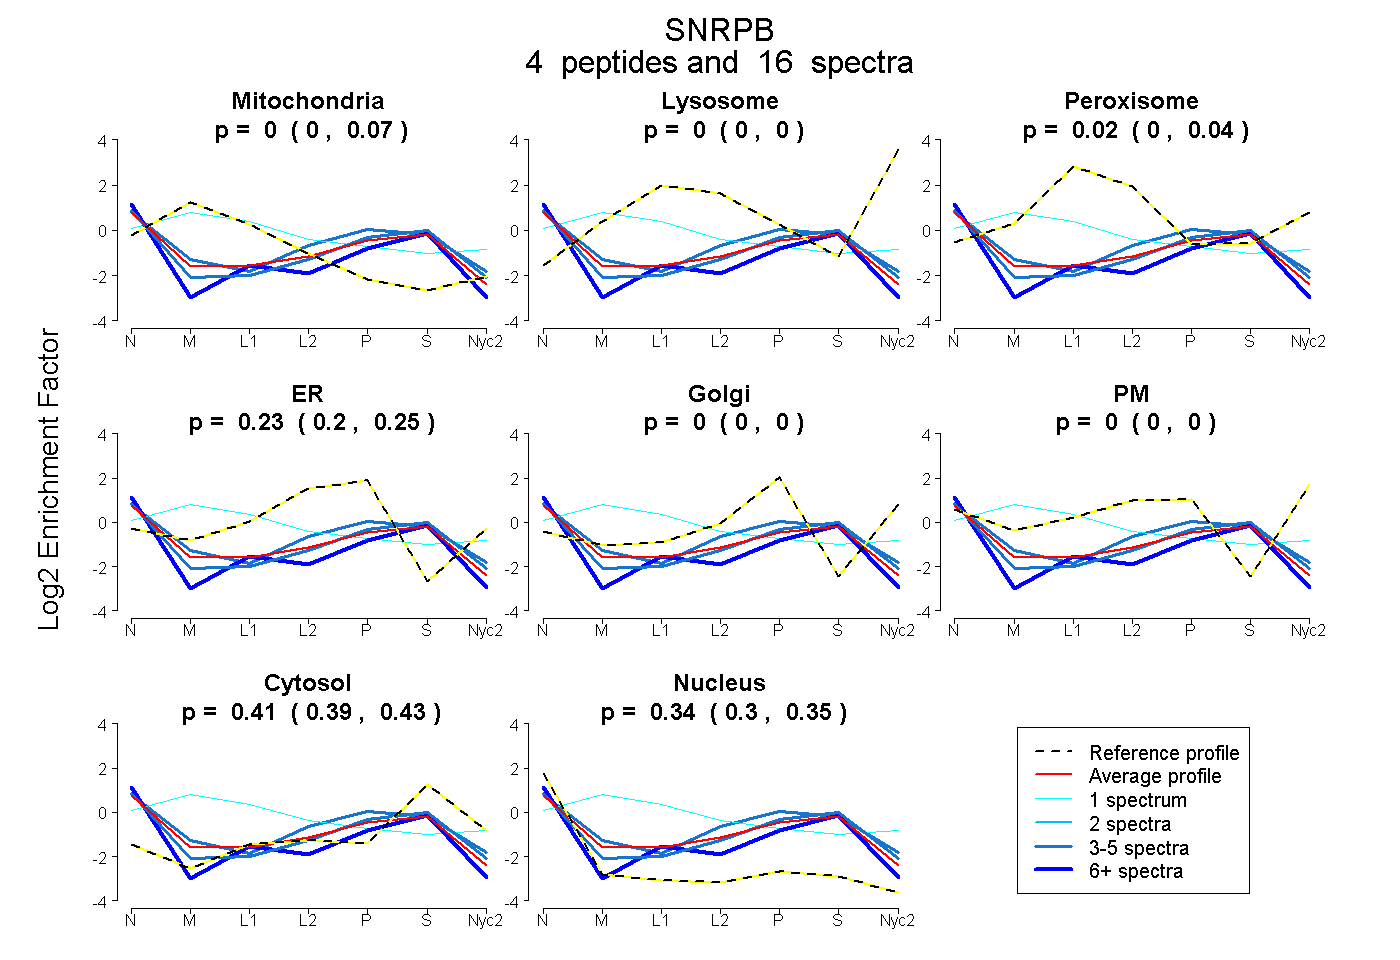
0.000 | 0.066
0.000 | 0.000
0.000 | 0.043
0.204 | 0.250
0.000 | 0.000
0.000 | 0.000
0.385 | 0.432
0.295 | 0.353
2peptides
spectra
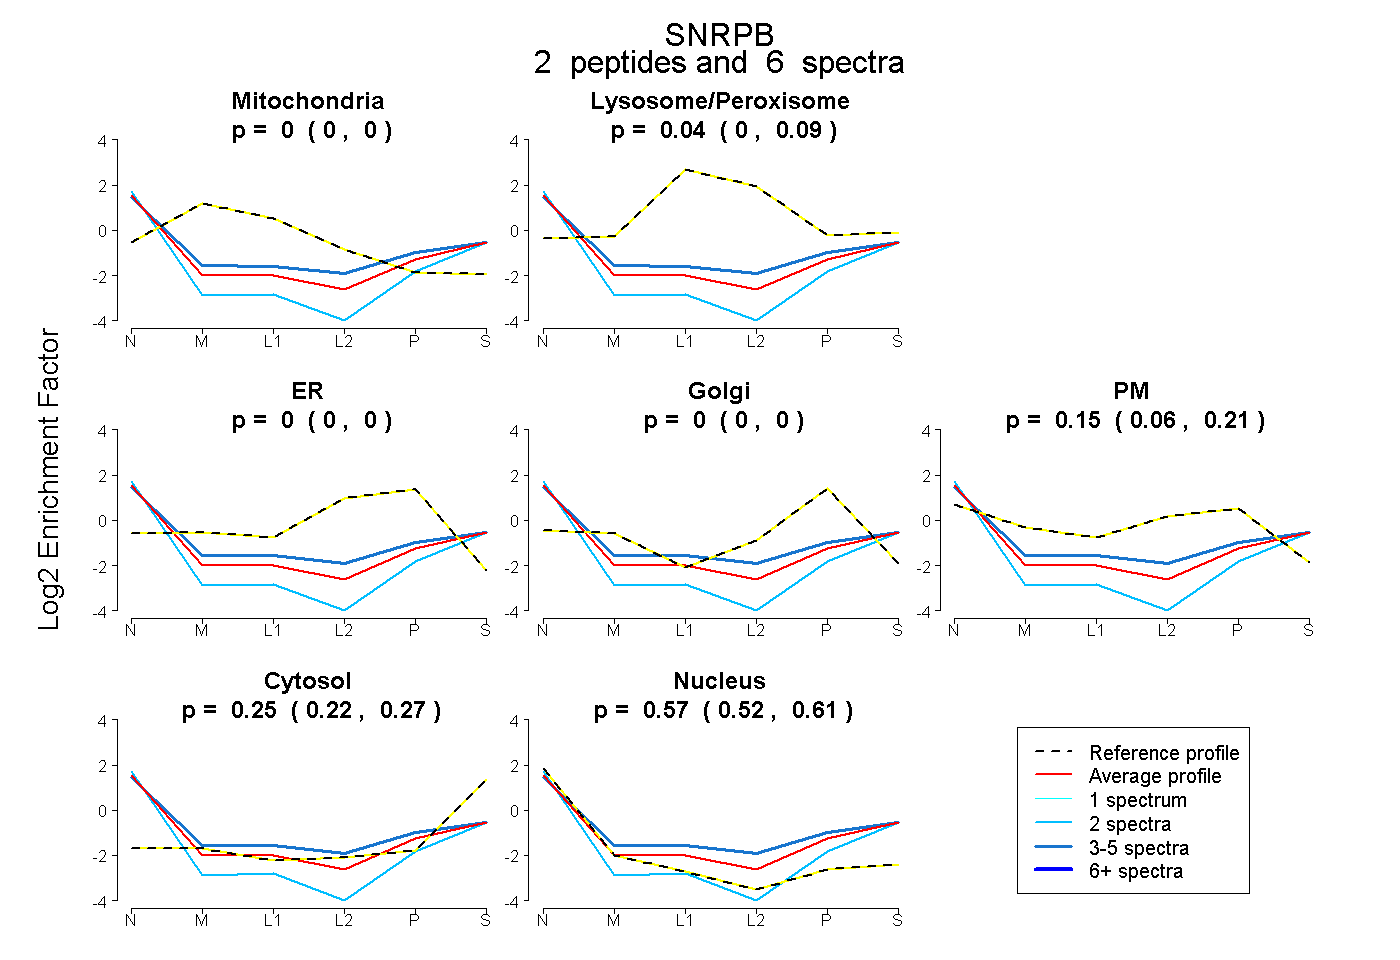
0.000 | 0.000
0.000 | 0.091
0.000 | 0.000
0.000 | 0.000
0.064 | 0.208
0.215 | 0.269
0.522 | 0.613
2peptides
spectra
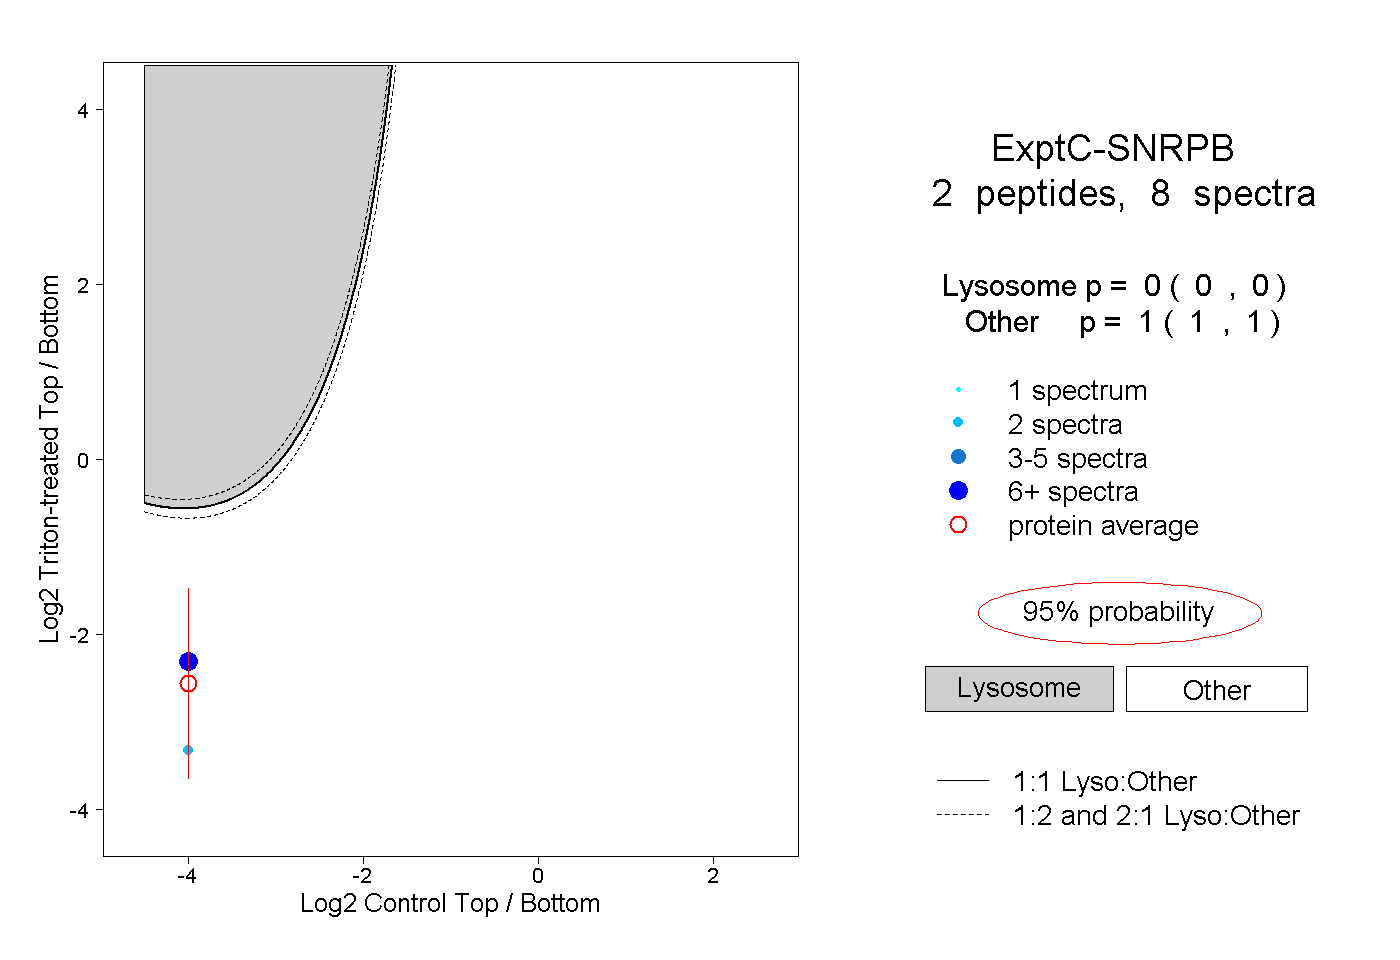
0.000 | 0.000
1.000 | 1.000