 4
4peptides
spectra
0.000 | 0.066
0.000 | 0.000
0.000 | 0.043
0.204 | 0.250
0.000 | 0.000
0.000 | 0.000
0.385 | 0.432
0.295 | 0.353
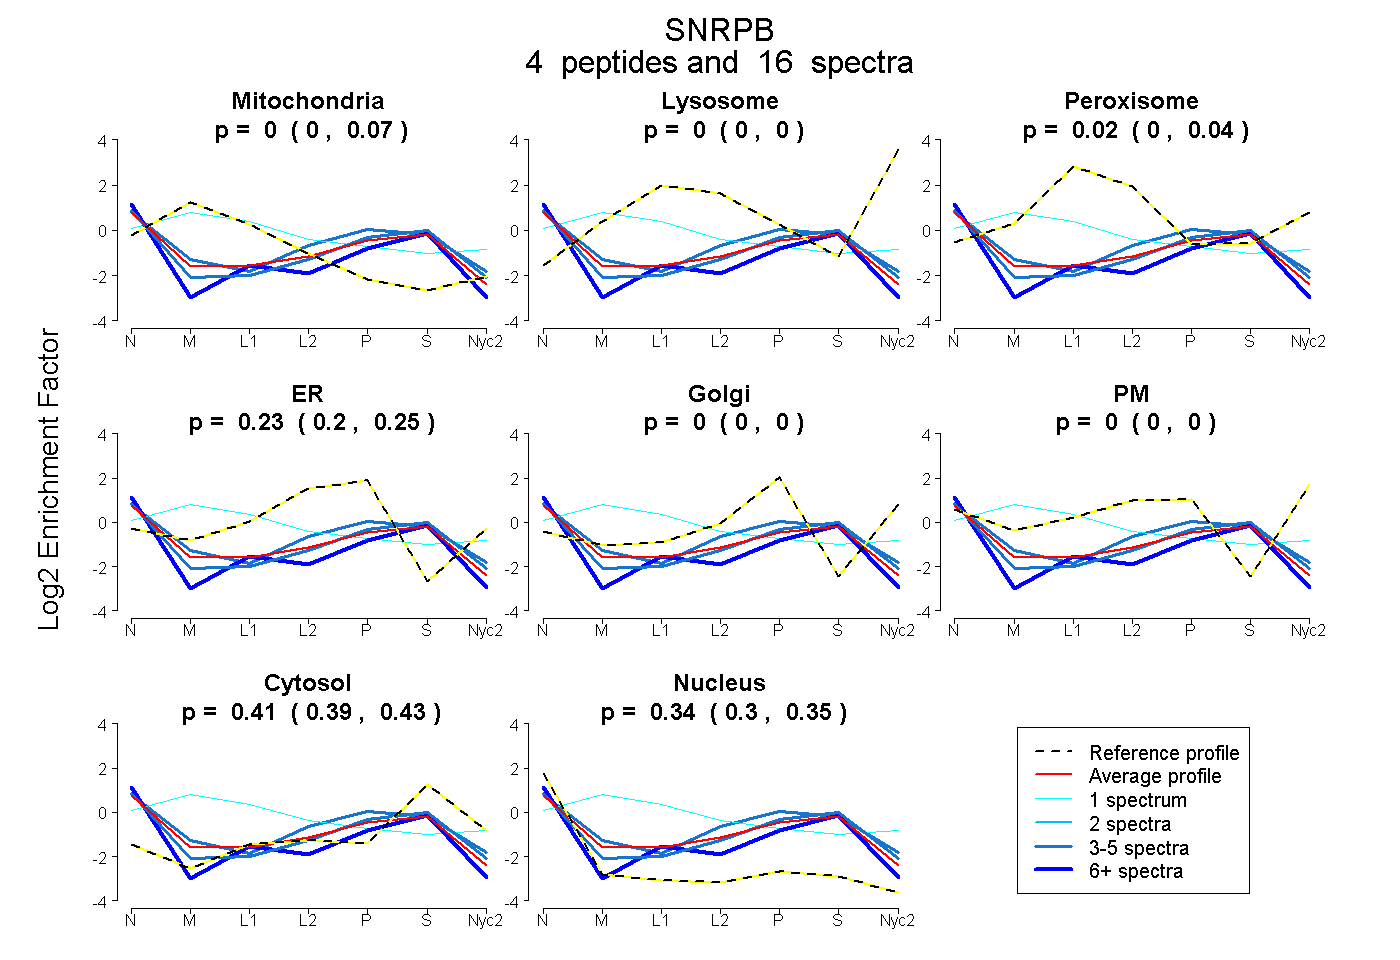
| Plot | Mito | Lyso | Perox | ER | Golgi | PM | Cytosol | Nucleus | |||||
| Expt A |
4 peptides |
16 spectra |
|
0.000 0.000 | 0.066 |
0.000 0.000 | 0.000 |
0.023 0.000 | 0.043 |
0.230 0.204 | 0.250 |
0.000 0.000 | 0.000 |
0.000 0.000 | 0.000 |
0.406 0.385 | 0.432 |
0.341 0.295 | 0.353 |
| 3 spectra, MLQHIDYR | 0.000 | 0.000 | 0.000 | 0.207 | 0.000 | 0.000 | 0.462 | 0.331 | ||
| 1 spectrum, HMNLILCDCDEFR | 0.481 | 0.000 | 0.211 | 0.000 | 0.070 | 0.098 | 0.140 | 0.000 | ||
| 9 spectra, IFIGTFK | 0.000 | 0.000 | 0.000 | 0.087 | 0.000 | 0.000 | 0.446 | 0.467 | ||
| 3 spectra, GENLVSMTVEGPPPK | 0.000 | 0.000 | 0.000 | 0.346 | 0.000 | 0.000 | 0.398 | 0.257 |
| Plot | Mito | Lyso or Perox | ER | Golgi | PM | Cytosol | Nucleus | ||||||
| Expt B |
2 peptides |
6 spectra |
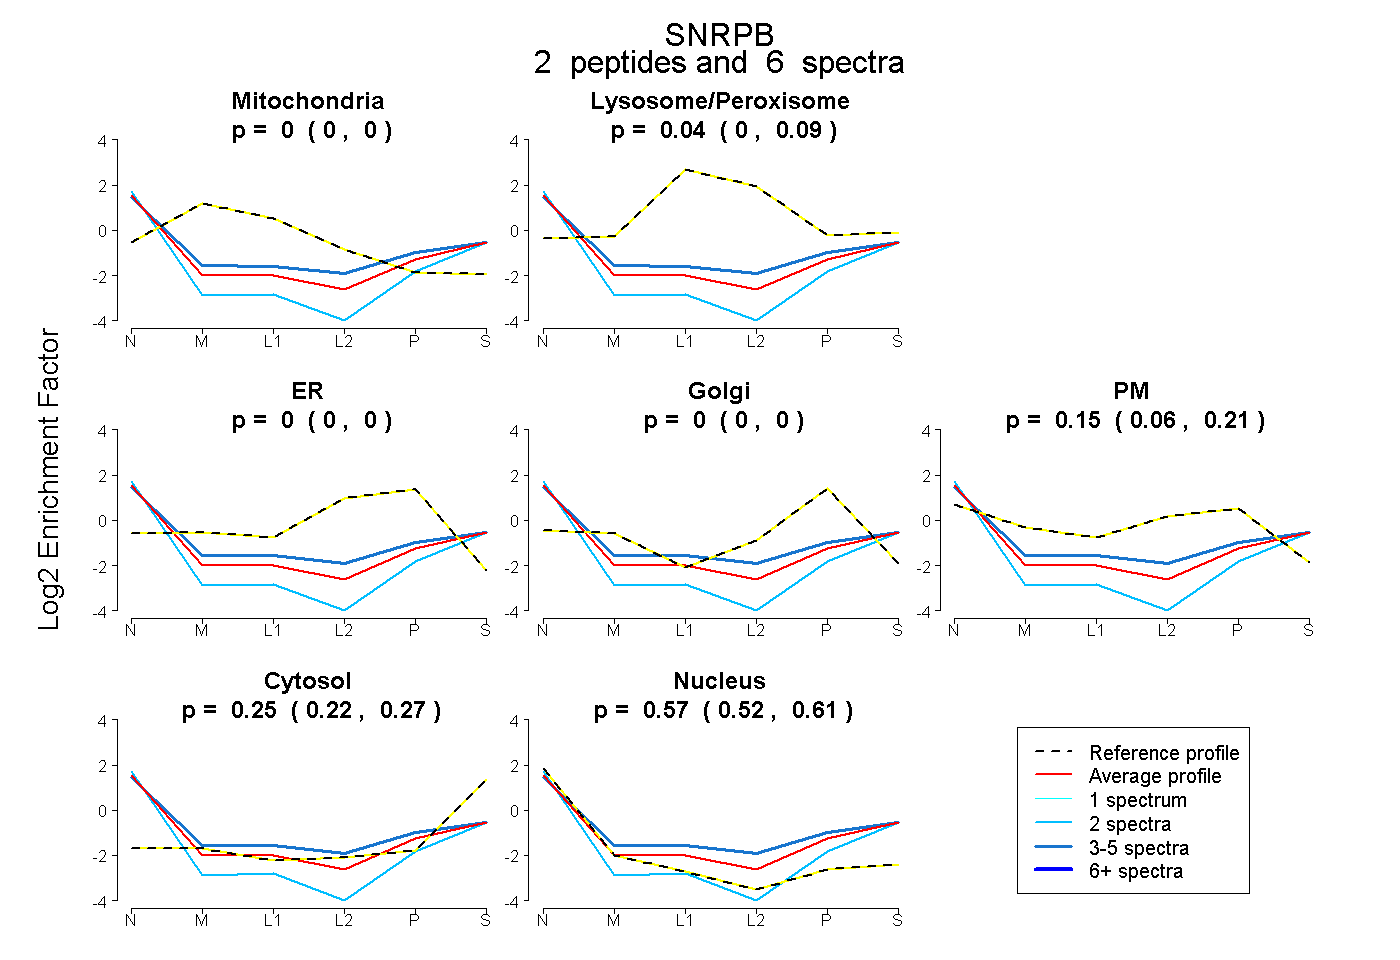 |
0.000 0.000 | 0.000 |
0.038 0.000 | 0.091 |
0.000 0.000 | 0.000 |
0.000 0.000 | 0.000 |
0.147 0.064 | 0.208 |
0.246 0.215 | 0.269 |
0.568 0.522 | 0.613 |
|||
| Plot | Lyso | Other | |||||||||||
| Expt C |
2 peptides |
8 spectra |
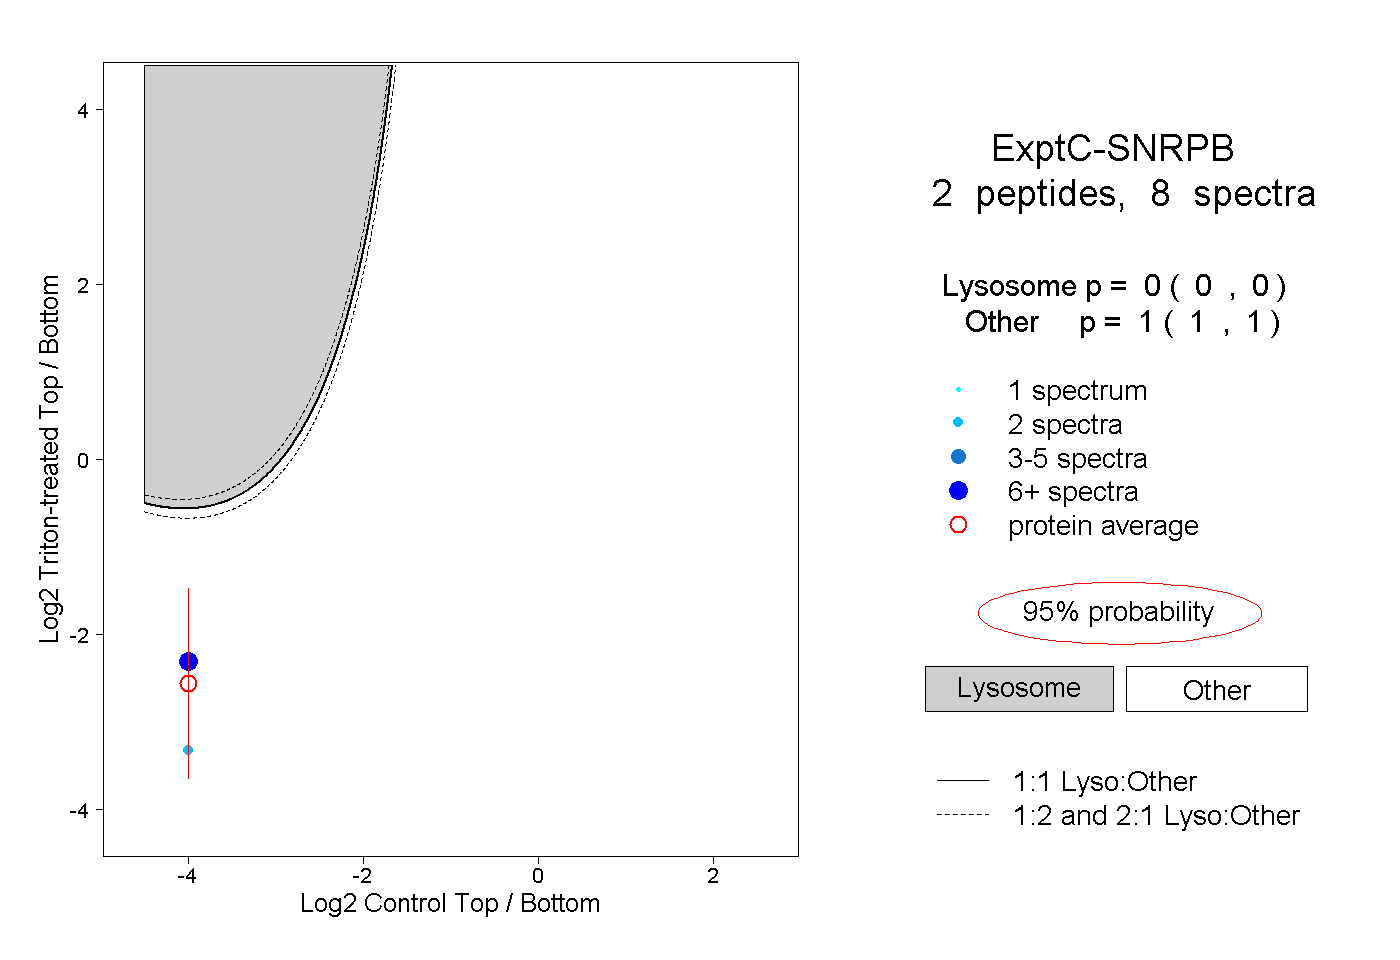 |
0.000 0.000 | 0.000 |
1.000 1.000 | 1.000 |