 6
6peptides
spectra
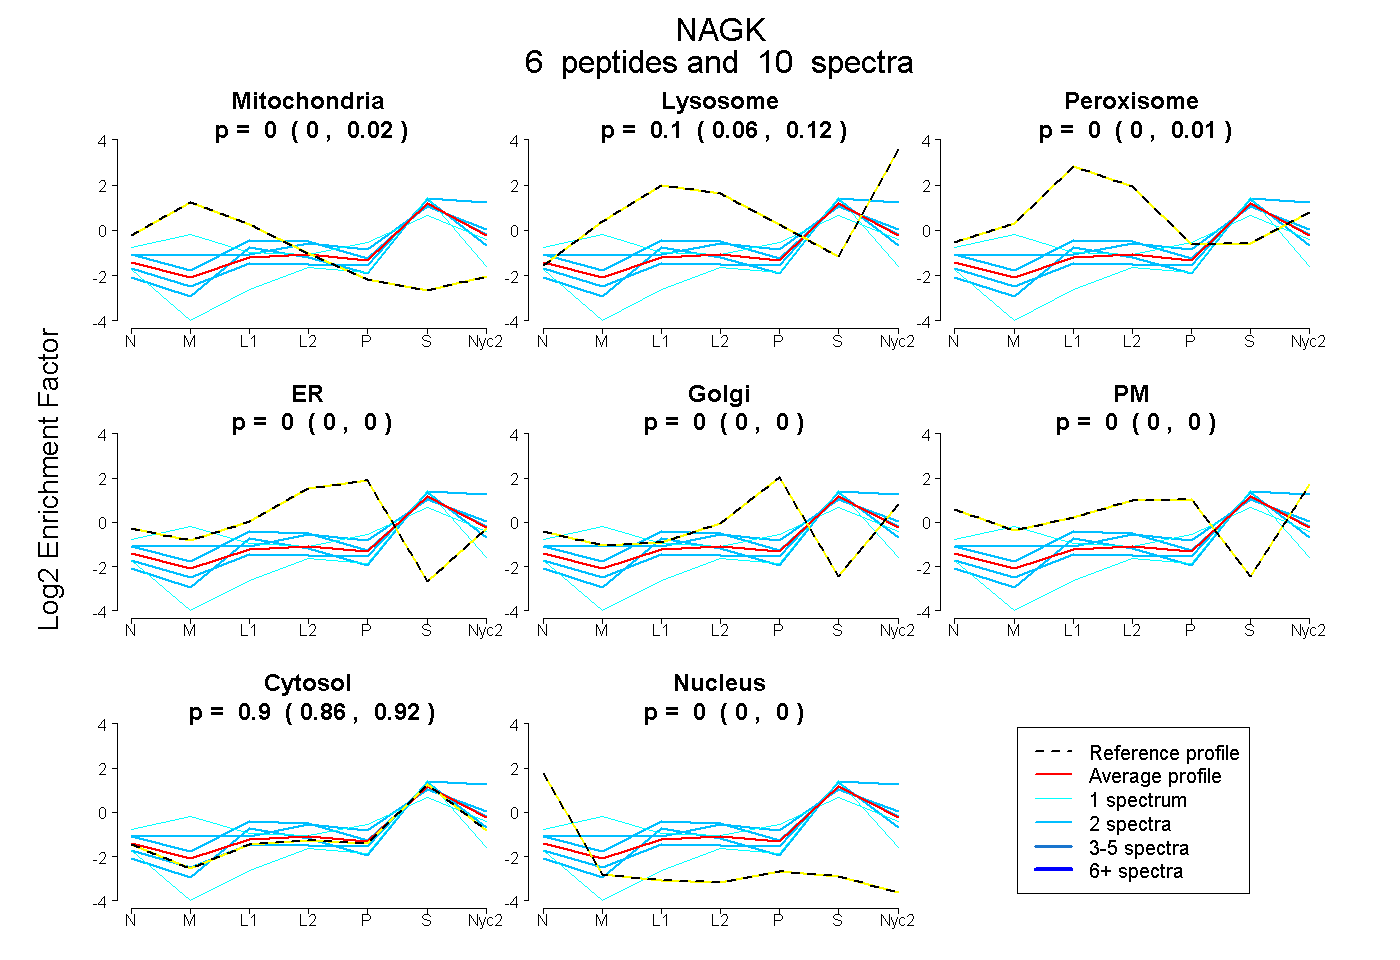
0.000 | 0.024
0.063 | 0.122
0.000 | 0.009
0.000 | 0.000
0.000 | 0.000
0.000 | 0.000
0.863 | 0.921
0.000 | 0.000
3peptides
spectra
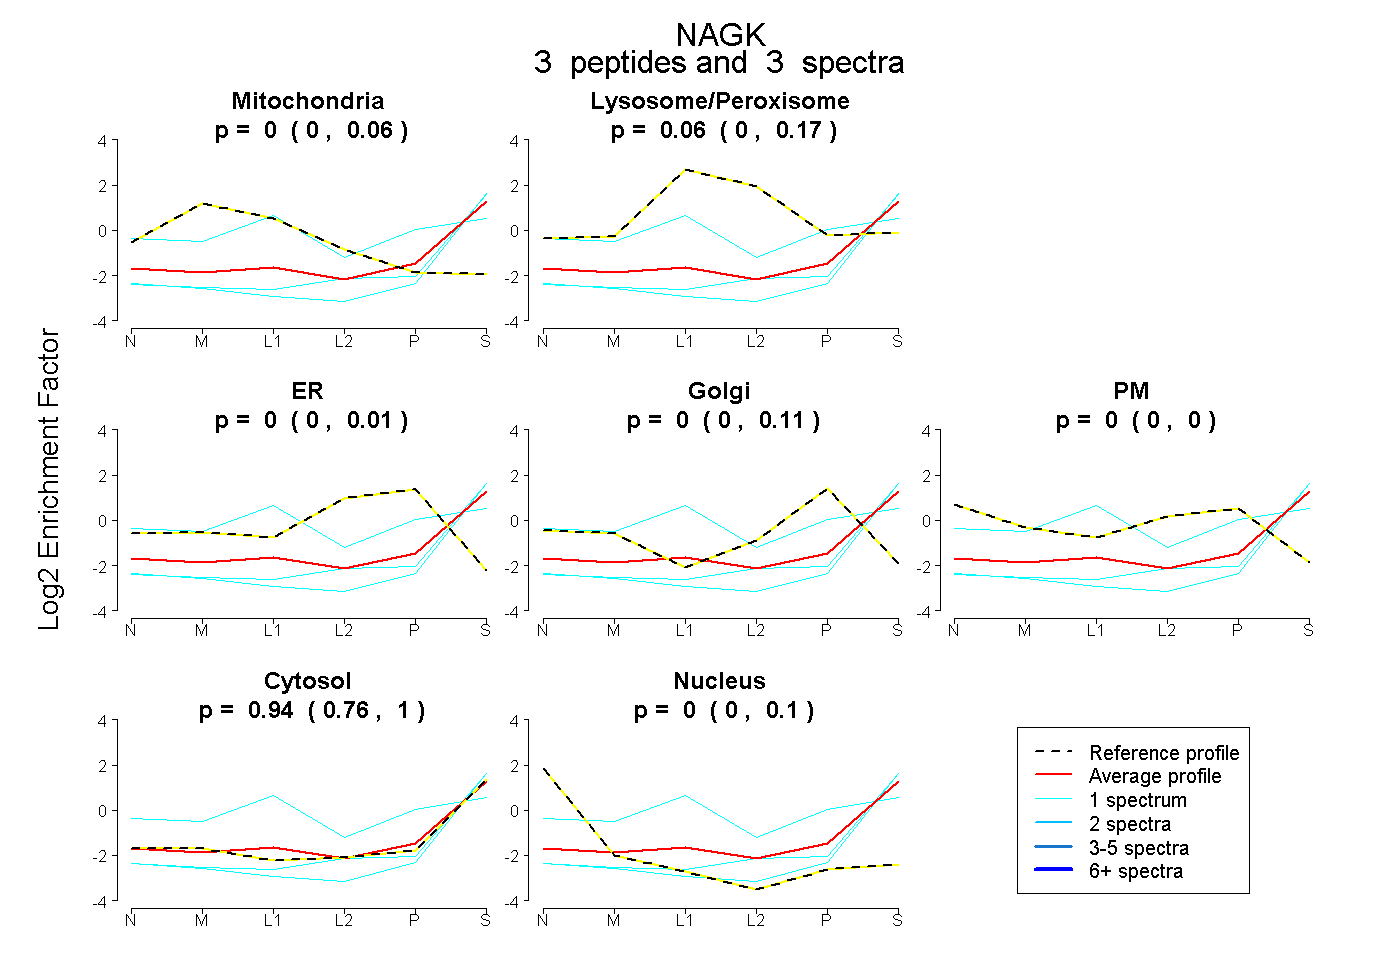
0.000 | 0.064
0.000 | 0.166
0.000 | 0.013
0.000 | 0.114
0.000 | 0.000
0.759 | 0.999
0.000 | 0.097
6peptides
spectra
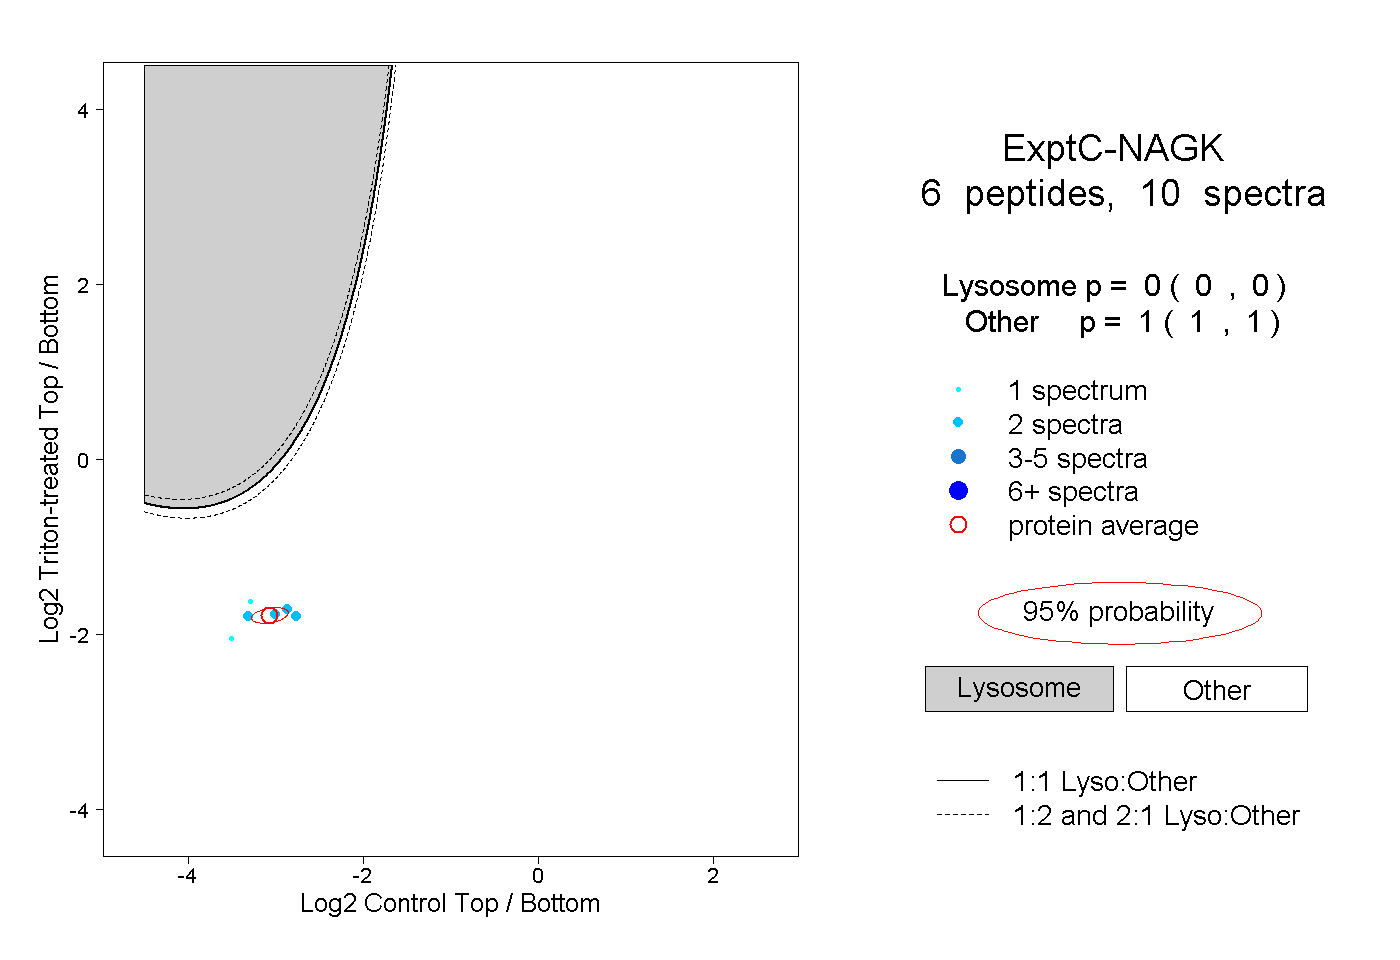
0.000 | 0.000
1.000 | 1.000