 6
6peptides
spectra
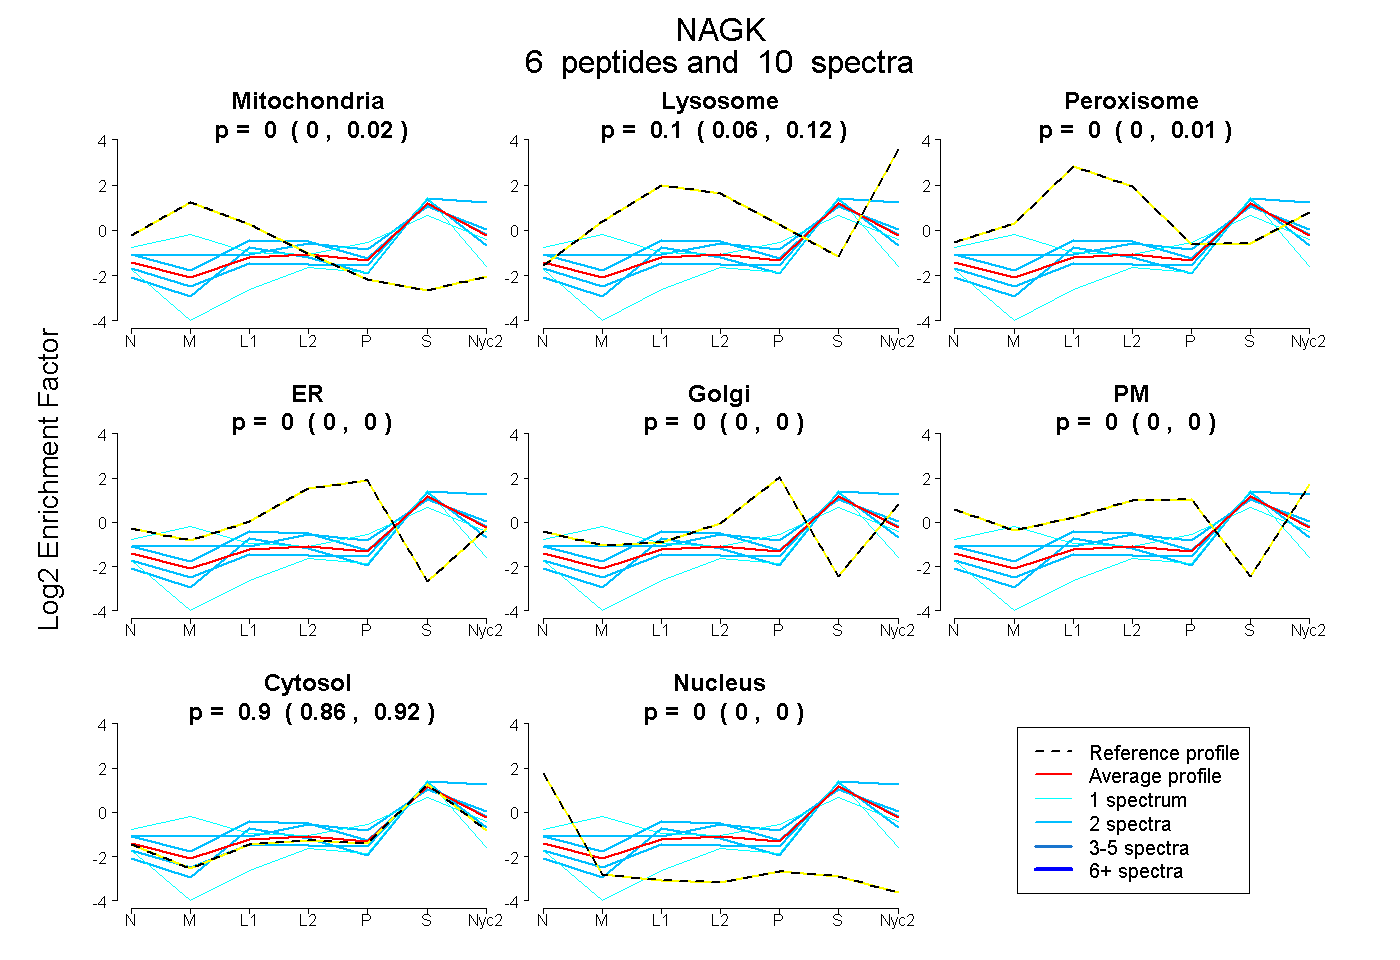
0.000 | 0.024
0.063 | 0.122
0.000 | 0.009
0.000 | 0.000
0.000 | 0.000
0.000 | 0.000
0.863 | 0.921
0.000 | 0.000
| Plot | Mito | Lyso | Perox | ER | Golgi | PM | Cytosol | Nucleus | |||||
| Expt A |
6 peptides |
10 spectra |
|
0.000 0.000 | 0.024 |
0.099 0.063 | 0.122 |
0.000 0.000 | 0.009 |
0.000 0.000 | 0.000 |
0.000 0.000 | 0.000 |
0.000 0.000 | 0.000 |
0.901 0.863 | 0.921 |
0.000 0.000 | 0.000 |
| 1 spectrum, SLGLSLSGGEQEDAVR | 0.213 | 0.116 | 0.000 | 0.000 | 0.089 | 0.000 | 0.582 | 0.000 | ||
| 2 spectra, AGVDPLVPLR | 0.000 | 0.000 | 0.000 | 0.000 | 0.000 | 0.000 | 1.000 | 0.000 | ||
| 2 spectra, IVFDSIDNLEAAPHDIGHVK | 0.000 | 0.032 | 0.210 | 0.000 | 0.000 | 0.000 | 0.758 | 0.000 | ||
| 2 spectra, INEMVDR | 0.034 | 0.178 | 0.000 | 0.000 | 0.000 | 0.049 | 0.739 | 0.000 | ||
| 1 spectrum, LLMEELR | 0.000 | 0.000 | 0.000 | 0.000 | 0.000 | 0.000 | 0.905 | 0.095 | ||
| 2 spectra, IAEGAQQGDPLSR | 0.000 | 0.167 | 0.000 | 0.000 | 0.000 | 0.000 | 0.833 | 0.000 |
| Plot | Mito | Lyso or Perox | ER | Golgi | PM | Cytosol | Nucleus | ||||||
| Expt B |
3 peptides |
3 spectra |
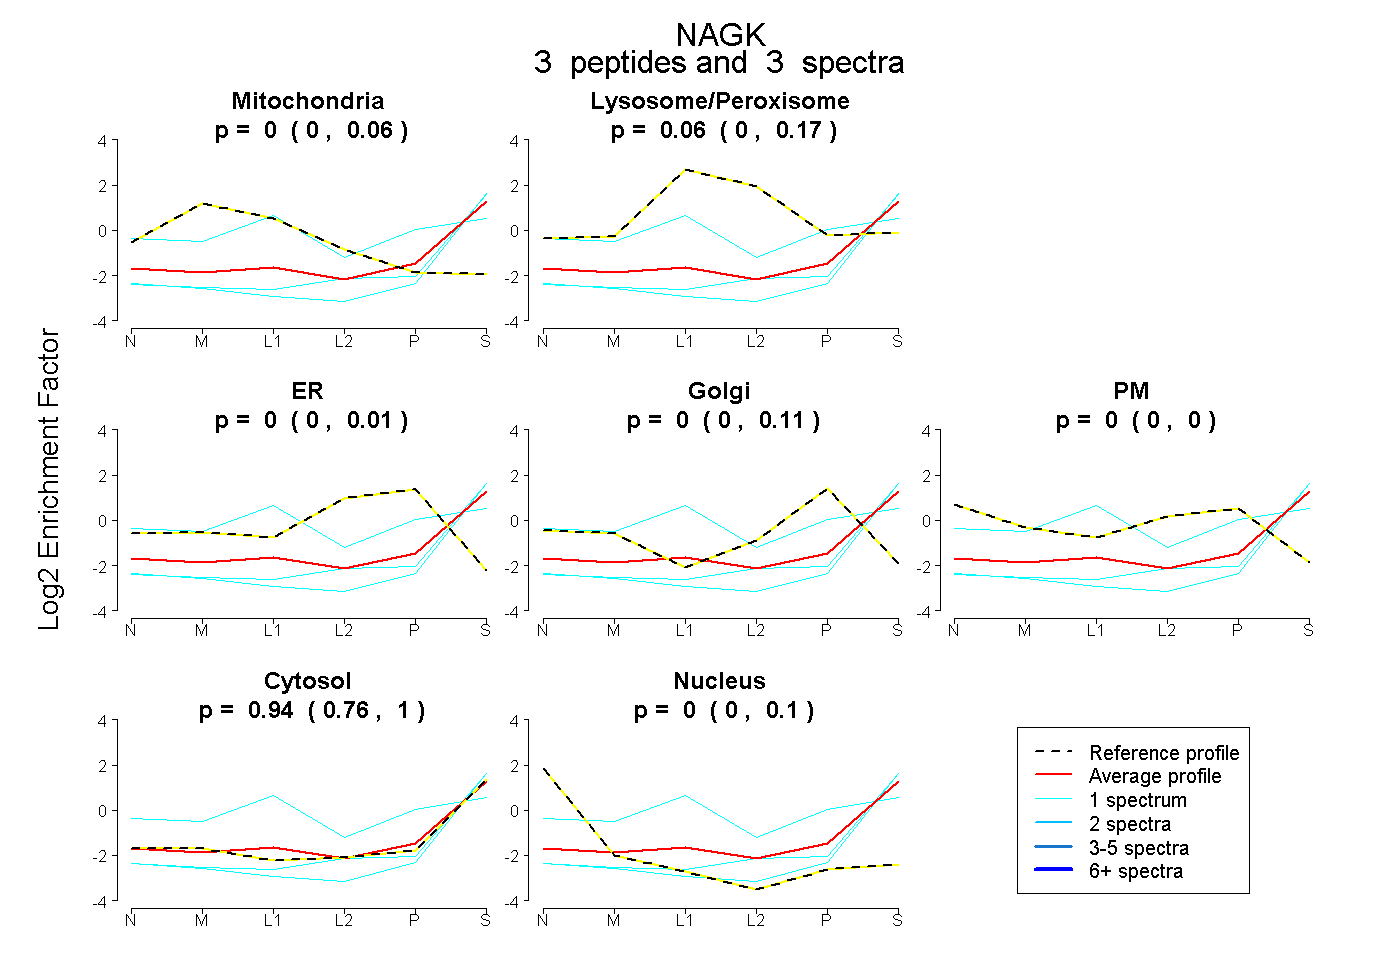 |
0.000 0.000 | 0.064 |
0.062 0.000 | 0.166 |
0.000 0.000 | 0.013 |
0.001 0.000 | 0.114 |
0.000 0.000 | 0.000 |
0.936 0.759 | 0.999 |
0.002 0.000 | 0.097 |
|||
| Plot | Lyso | Other | |||||||||||
| Expt C |
6 peptides |
10 spectra |
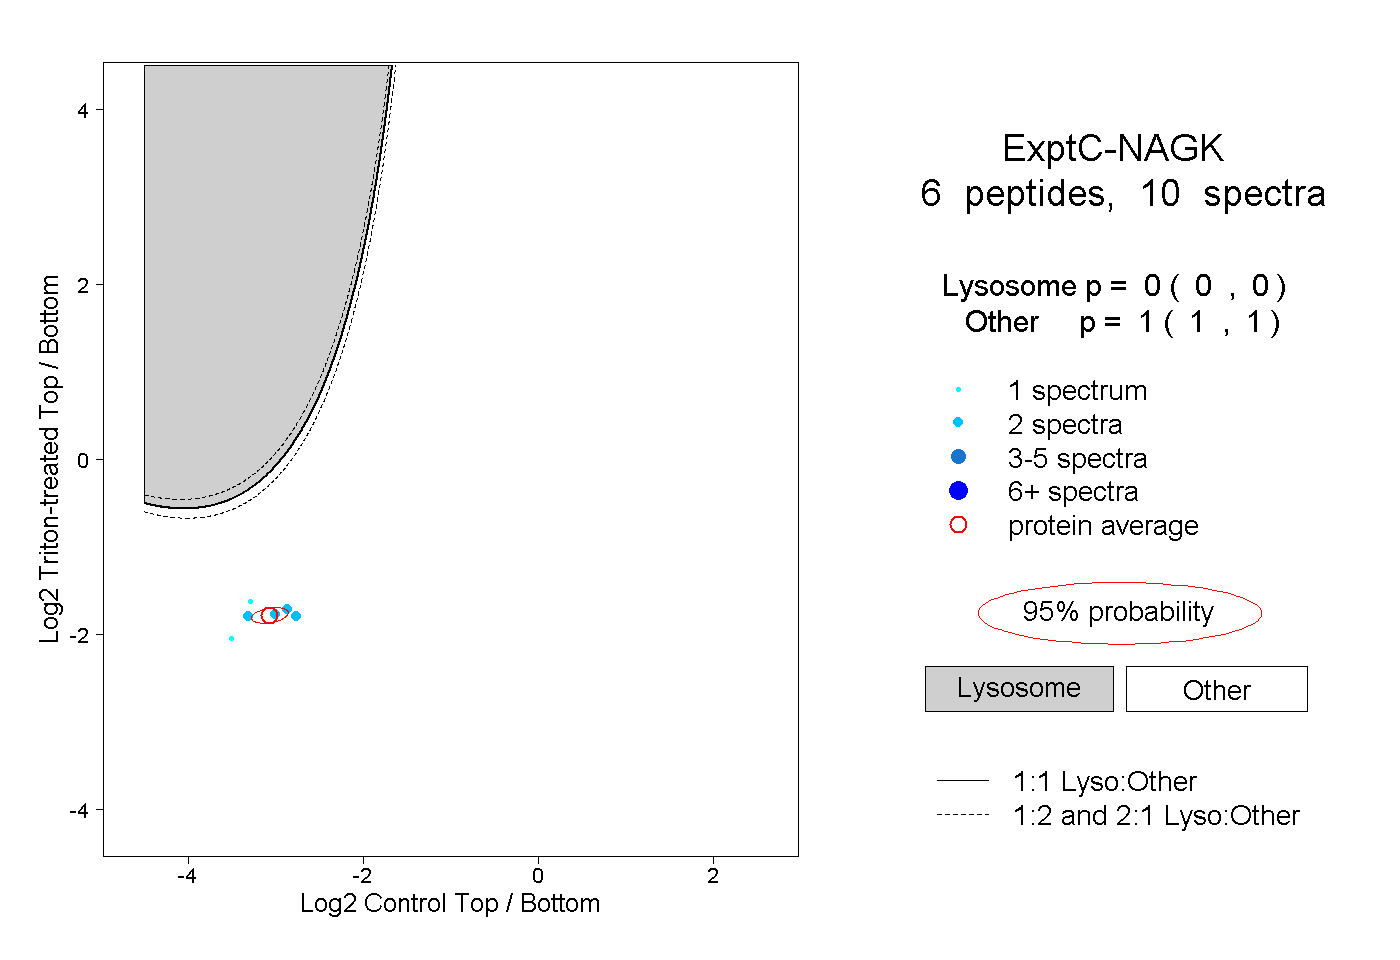 |
0.000 0.000 | 0.000 |
1.000 1.000 | 1.000 |