 9
9peptides
spectra
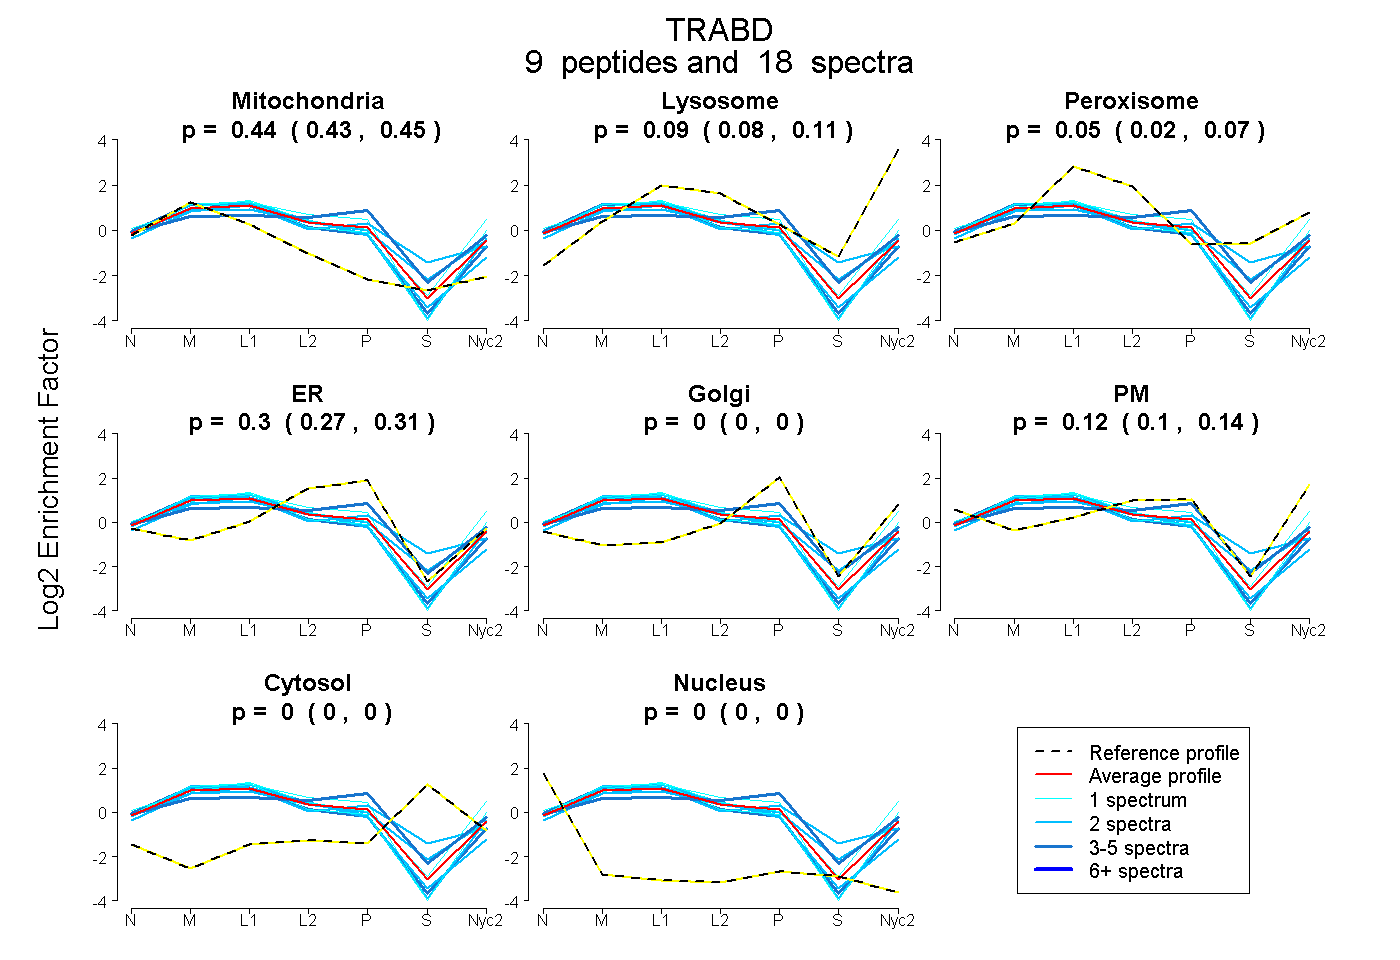
0.428 | 0.450
0.077 | 0.106
0.019 | 0.074
0.273 | 0.314
0.000 | 0.000
0.104 | 0.137
0.000 | 0.000
0.000 | 0.000
3peptides
spectra
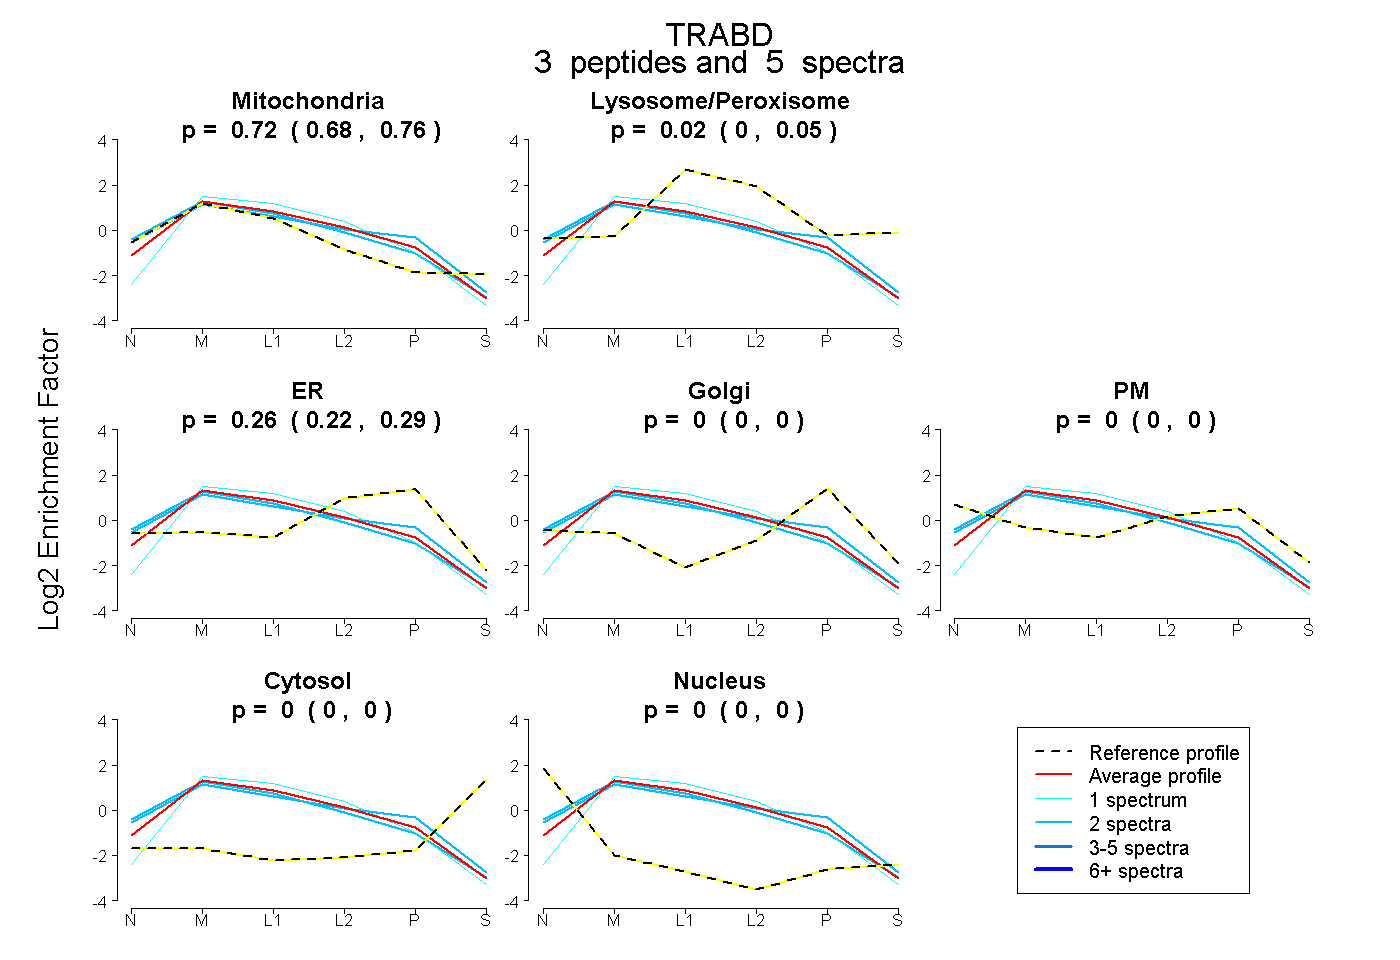
0.676 | 0.756
0.000 | 0.049
0.215 | 0.293
0.000 | 0.000
0.000 | 0.000
0.000 | 0.000
0.000 | 0.000
12peptides
spectra
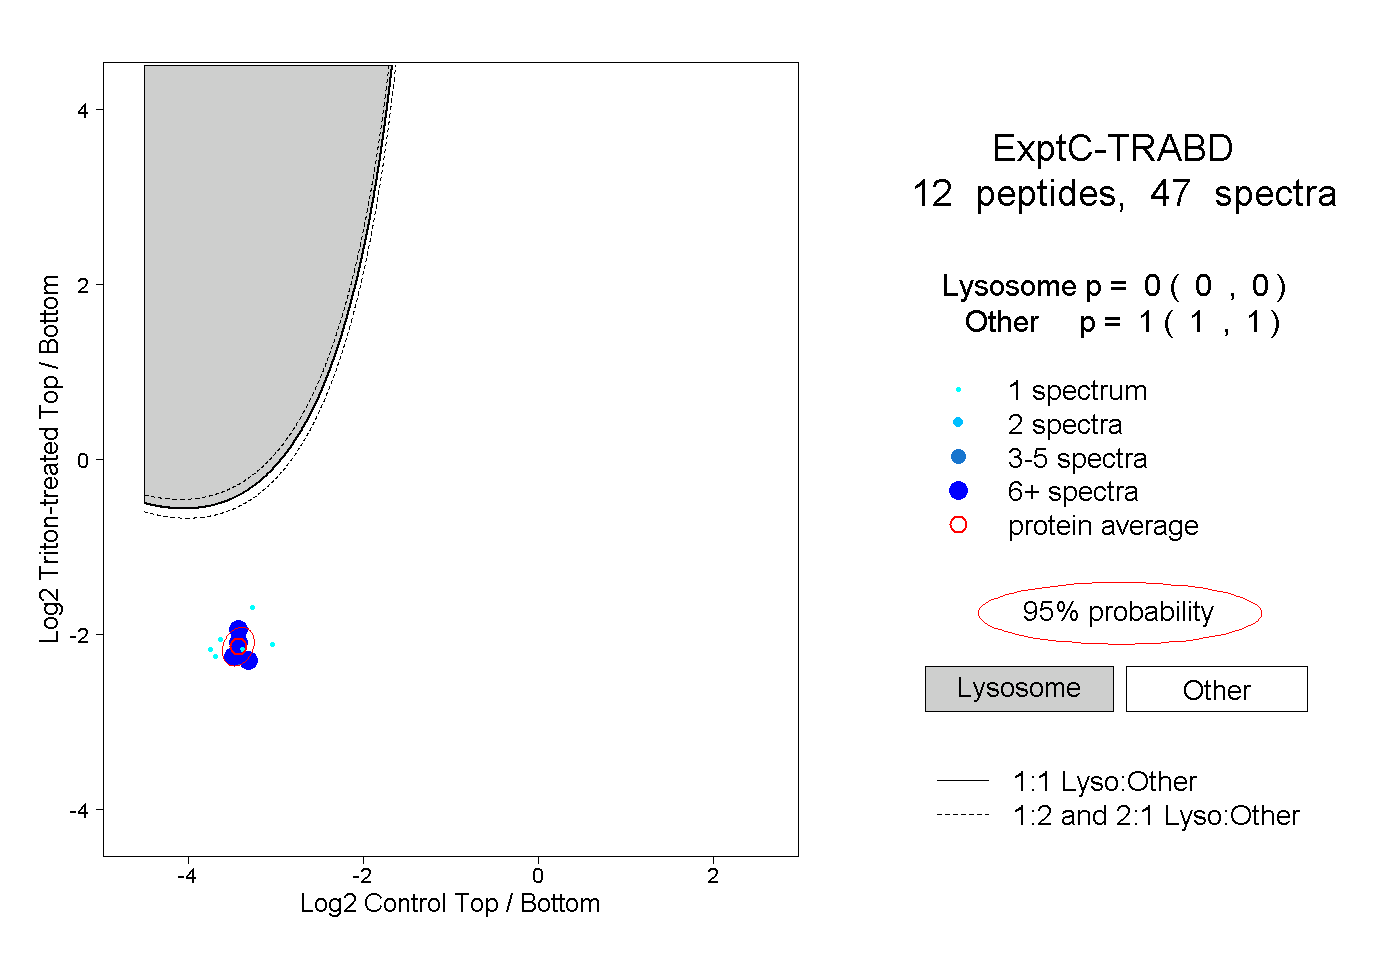
0.000 | 0.000
1.000 | 1.000
1peptide
spectra
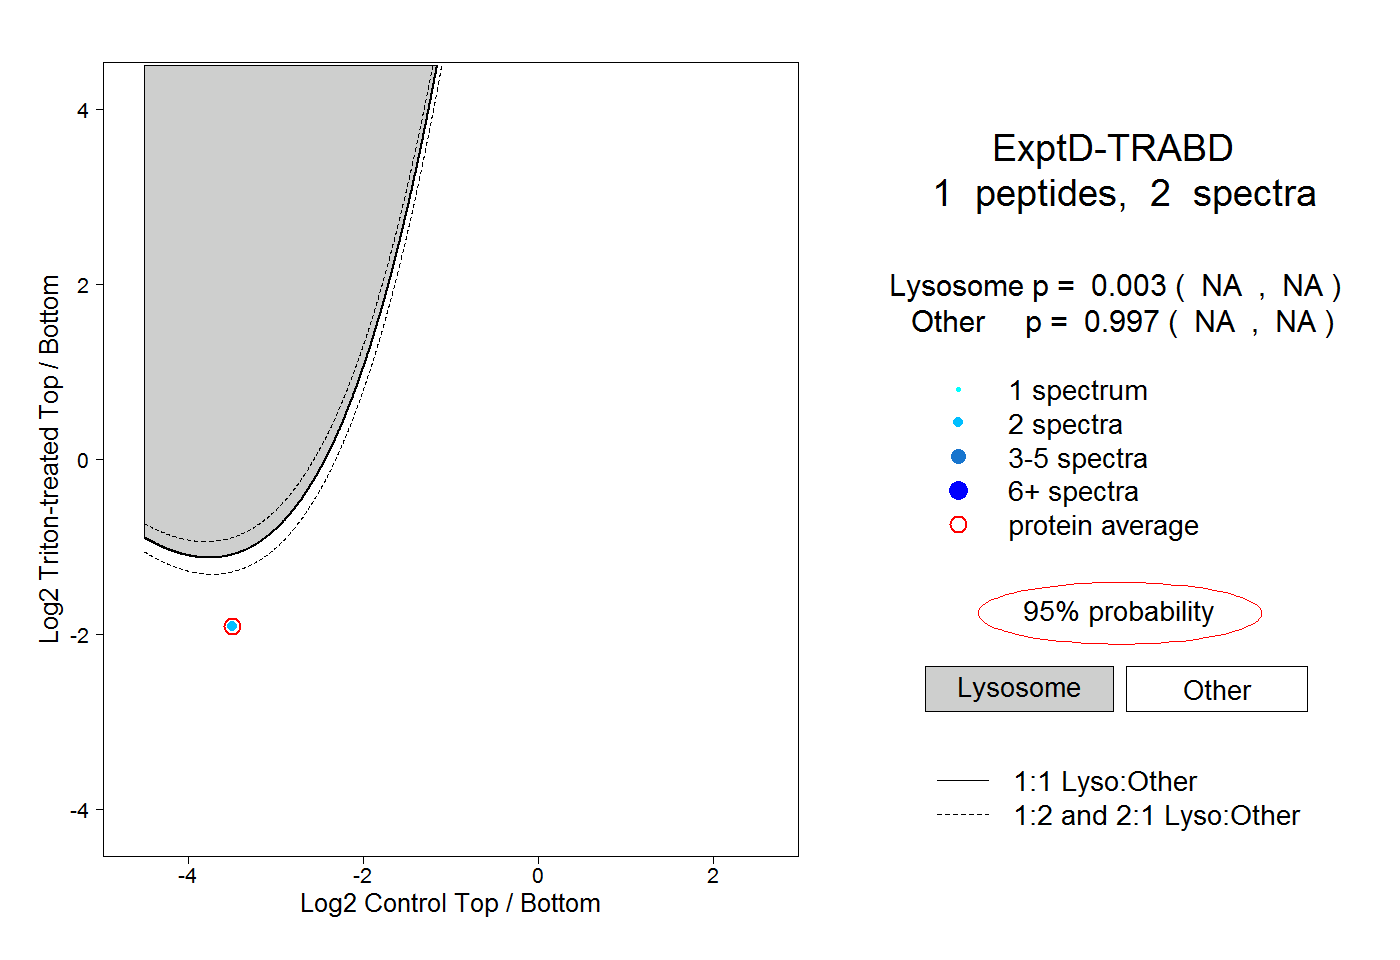
NA | NA
NA | NA