 9
9peptides
spectra
0.428 | 0.450
0.077 | 0.106
0.019 | 0.074
0.273 | 0.314
0.000 | 0.000
0.104 | 0.137
0.000 | 0.000
0.000 | 0.000
| Plot | Mito | Lyso | Perox | ER | Golgi | PM | Cytosol | Nucleus | |||||
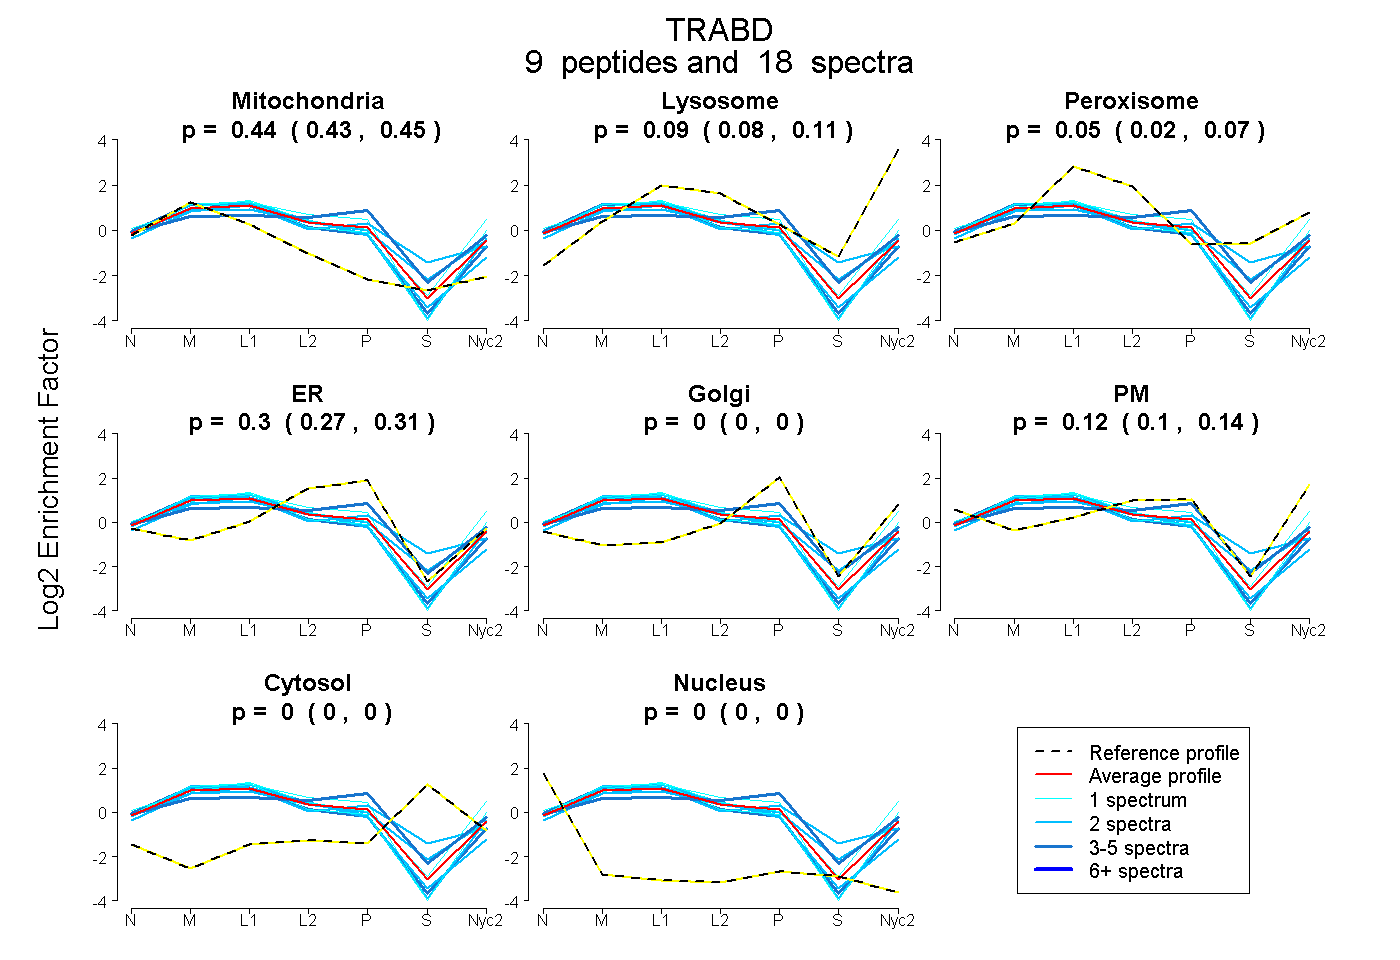
| Expt A |
9 peptides |
18 spectra |
|
0.440 0.428 | 0.450 |
0.093 0.077 | 0.106 |
0.050 0.019 | 0.074 |
0.296 0.273 | 0.314 |
0.000 0.000 | 0.000 |
0.122 0.104 | 0.137 |
0.000 0.000 | 0.000 |
0.000 0.000 | 0.000 |
| 1 spectrum, LQQAVK | 0.373 | 0.206 | 0.043 | 0.069 | 0.000 | 0.309 | 0.000 | 0.000 | ||
| 2 spectra, DVYLTYMLR | 0.361 | 0.000 | 0.340 | 0.093 | 0.206 | 0.000 | 0.000 | 0.000 | ||
| 1 spectrum, CVPSVVVGVVGMGHVPGIEK | 0.342 | 0.061 | 0.000 | 0.281 | 0.000 | 0.316 | 0.000 | 0.000 | ||
| 3 spectra, AIAALSFWQK | 0.542 | 0.051 | 0.000 | 0.248 | 0.000 | 0.158 | 0.000 | 0.000 | ||
| 4 spectra, TIVSER | 0.281 | 0.065 | 0.065 | 0.446 | 0.000 | 0.144 | 0.000 | 0.000 | ||
| 2 spectra, ERPNLPCTVTQLVAEDGSR | 0.404 | 0.023 | 0.197 | 0.230 | 0.000 | 0.146 | 0.000 | 0.000 | ||
| 2 spectra, FHLGDRPIPVTFK | 0.536 | 0.000 | 0.091 | 0.373 | 0.000 | 0.000 | 0.000 | 0.000 | ||
| 2 spectra, ASDAEPR | 0.492 | 0.113 | 0.000 | 0.243 | 0.000 | 0.152 | 0.000 | 0.000 | ||
| 1 spectrum, LAWGLCFLSDPISK | 0.477 | 0.093 | 0.000 | 0.099 | 0.000 | 0.330 | 0.000 | 0.000 |
| Plot | Mito | Lyso or Perox | ER | Golgi | PM | Cytosol | Nucleus | ||||||
| Expt B |
3 peptides |
5 spectra |
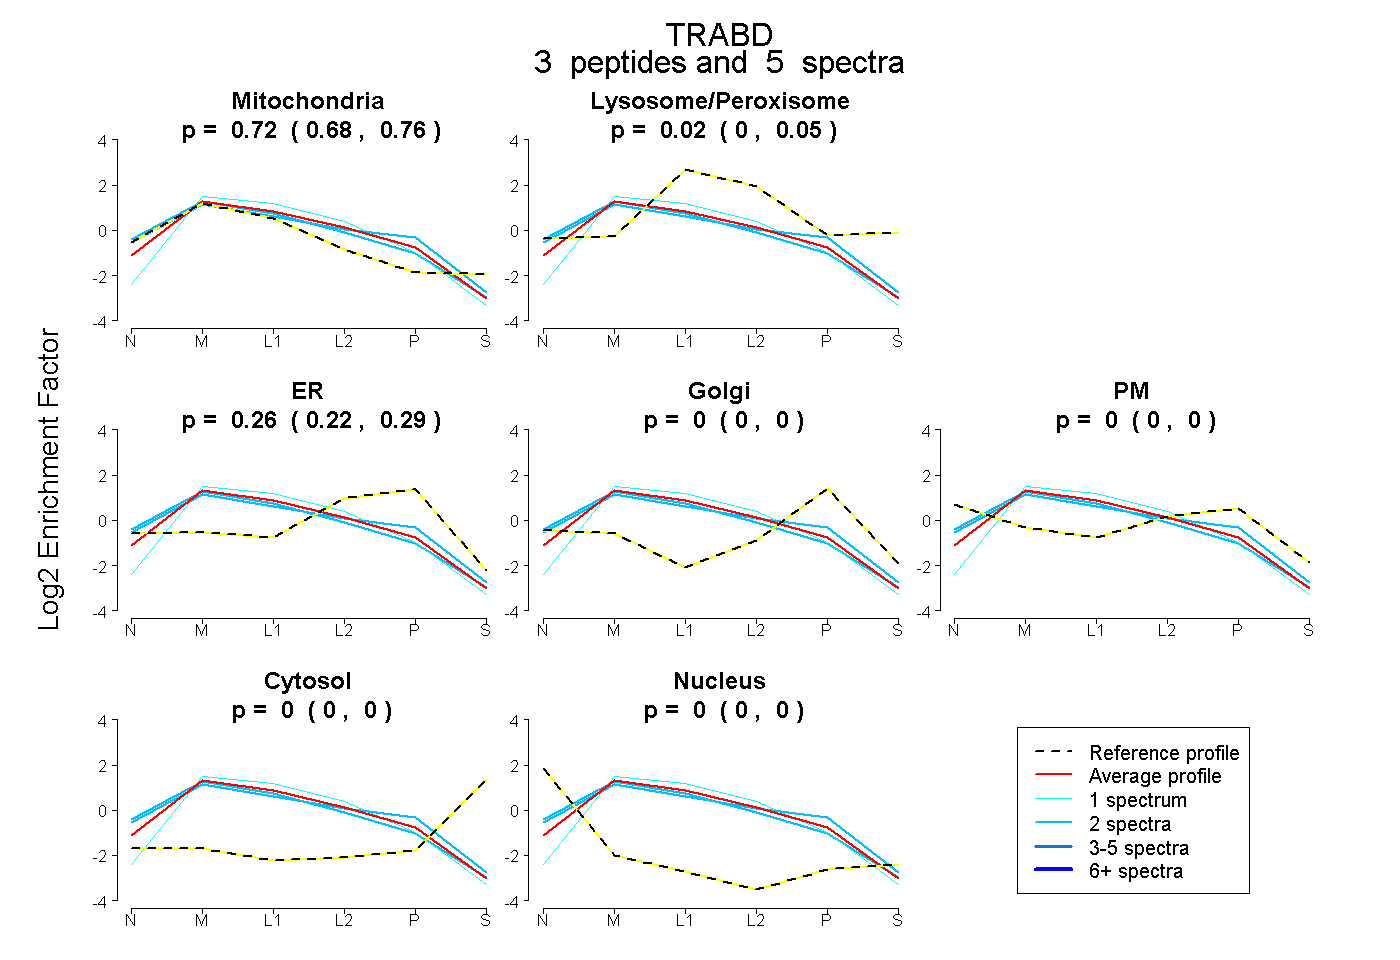 |
0.721 0.676 | 0.756 |
0.021 0.000 | 0.049 |
0.258 0.215 | 0.293 |
0.000 0.000 | 0.000 |
0.000 0.000 | 0.000 |
0.000 0.000 | 0.000 |
0.000 0.000 | 0.000 |
|||
| Plot | Lyso | Other | |||||||||||
| Expt C |
12 peptides |
47 spectra |
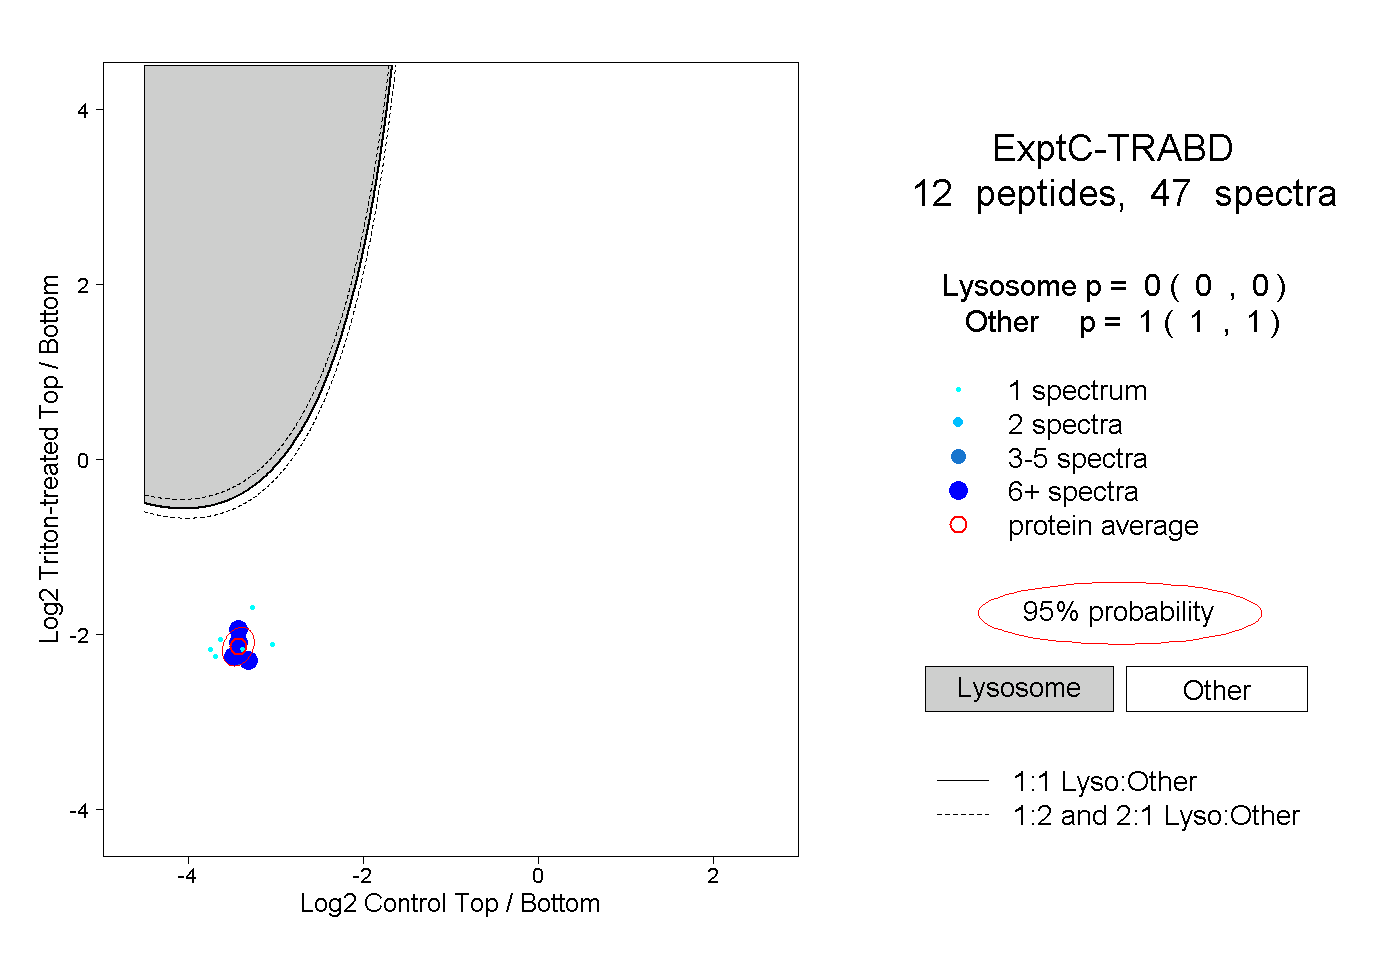 |
0.000 0.000 | 0.000 |
1.000 1.000 | 1.000 |
||||||||
| Plot | Lyso | Other | |||||||||||
| Expt D |
1 peptide |
2 spectra |
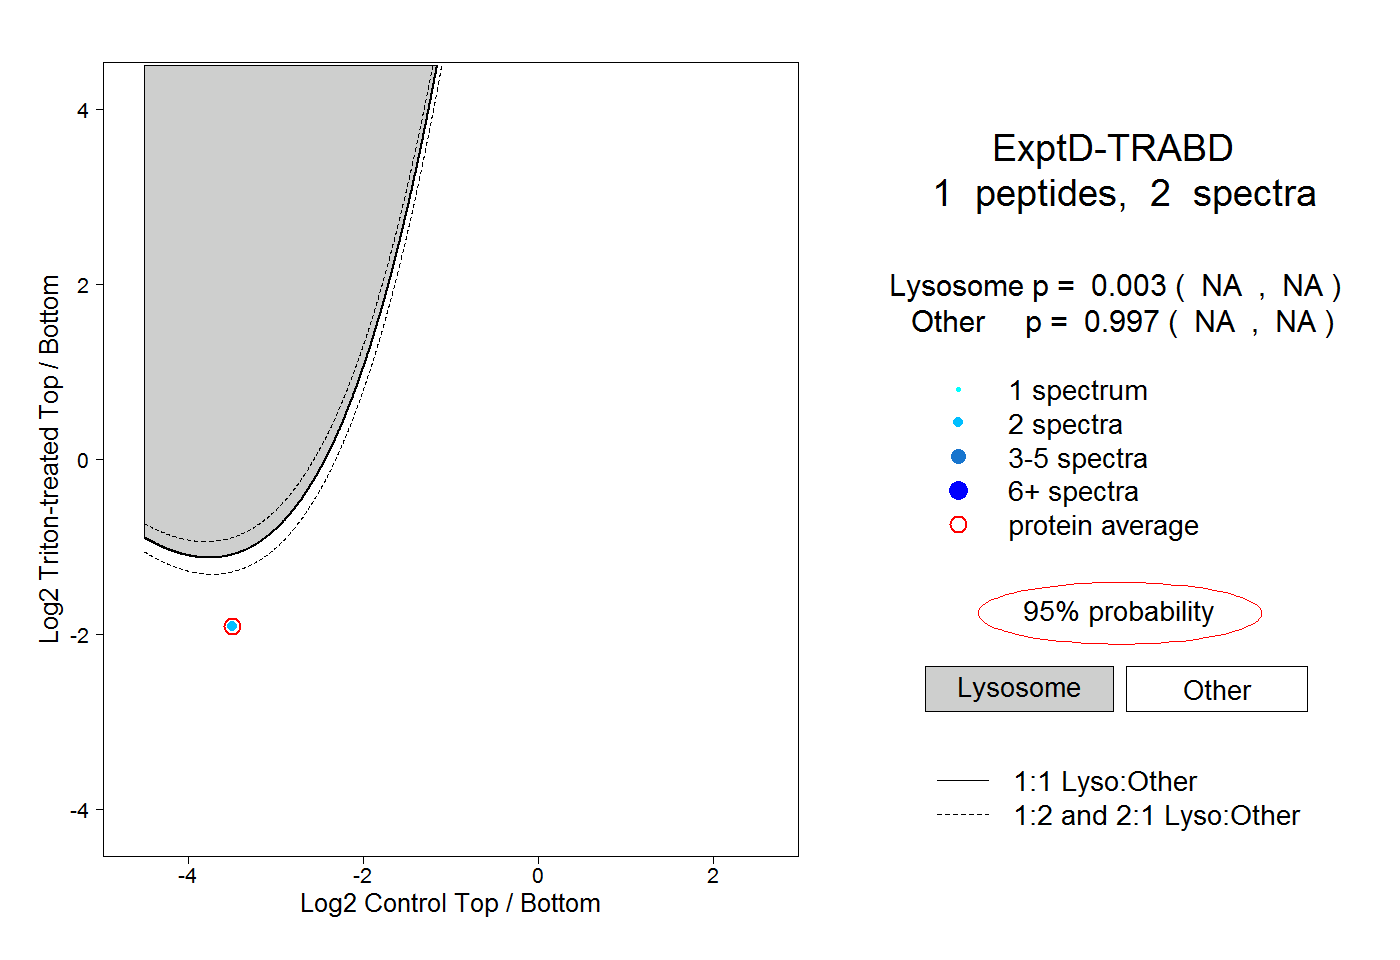 |
0.003 NA | NA |
0.997 NA | NA |