 3
3peptides
spectra
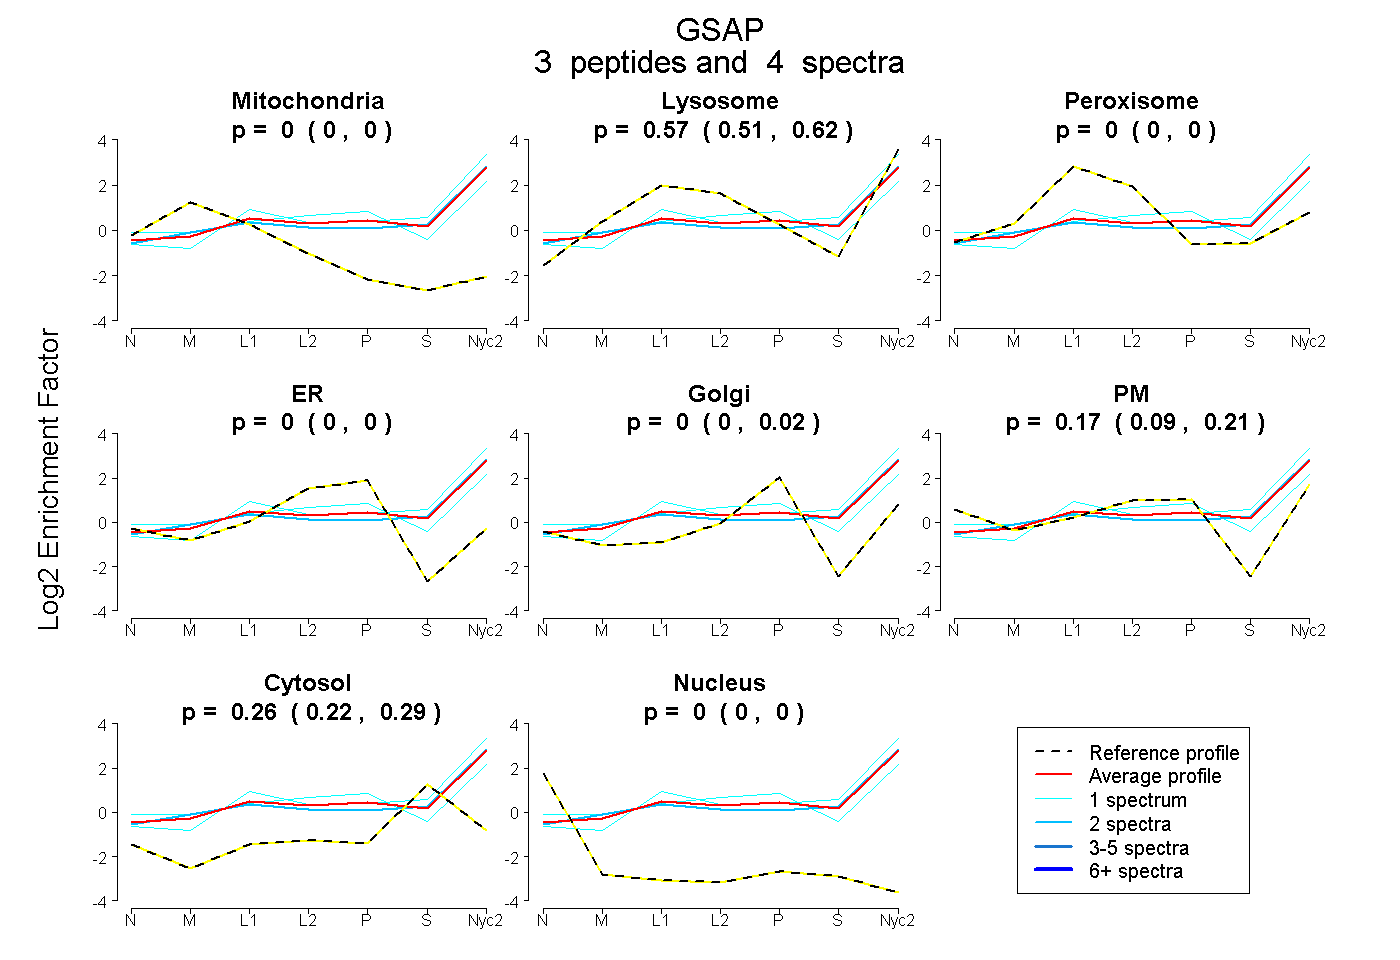
0.000 | 0.000
0.513 | 0.625
0.000 | 0.000
0.000 | 0.000
0.000 | 0.021
0.089 | 0.215
0.225 | 0.293
0.000 | 0.000
16peptides
spectra
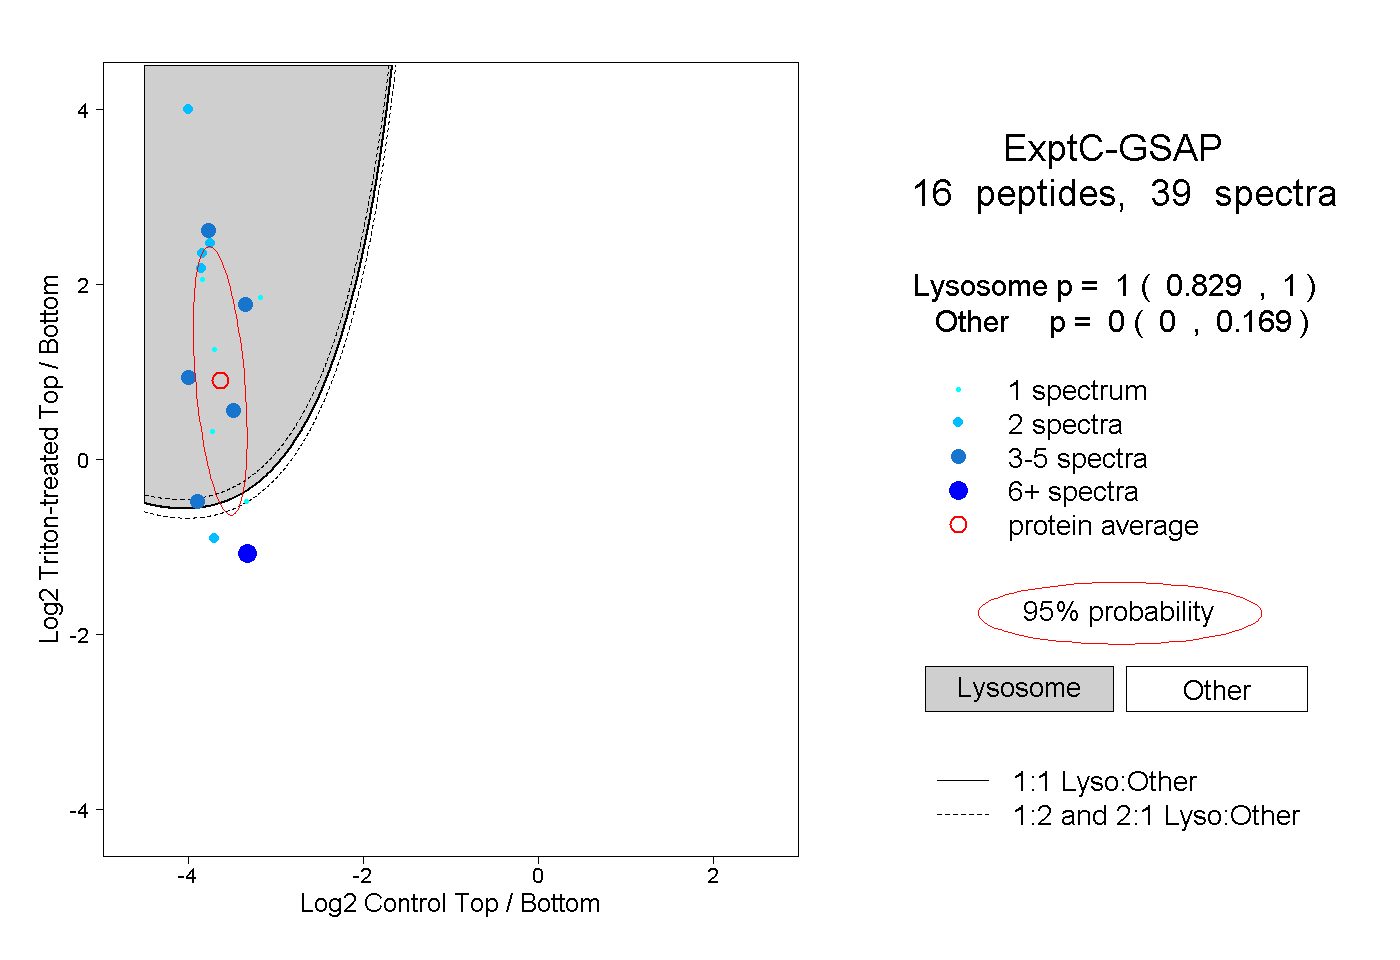
0.829 | 1.000
0.000 | 0.169
1peptide
spectrum
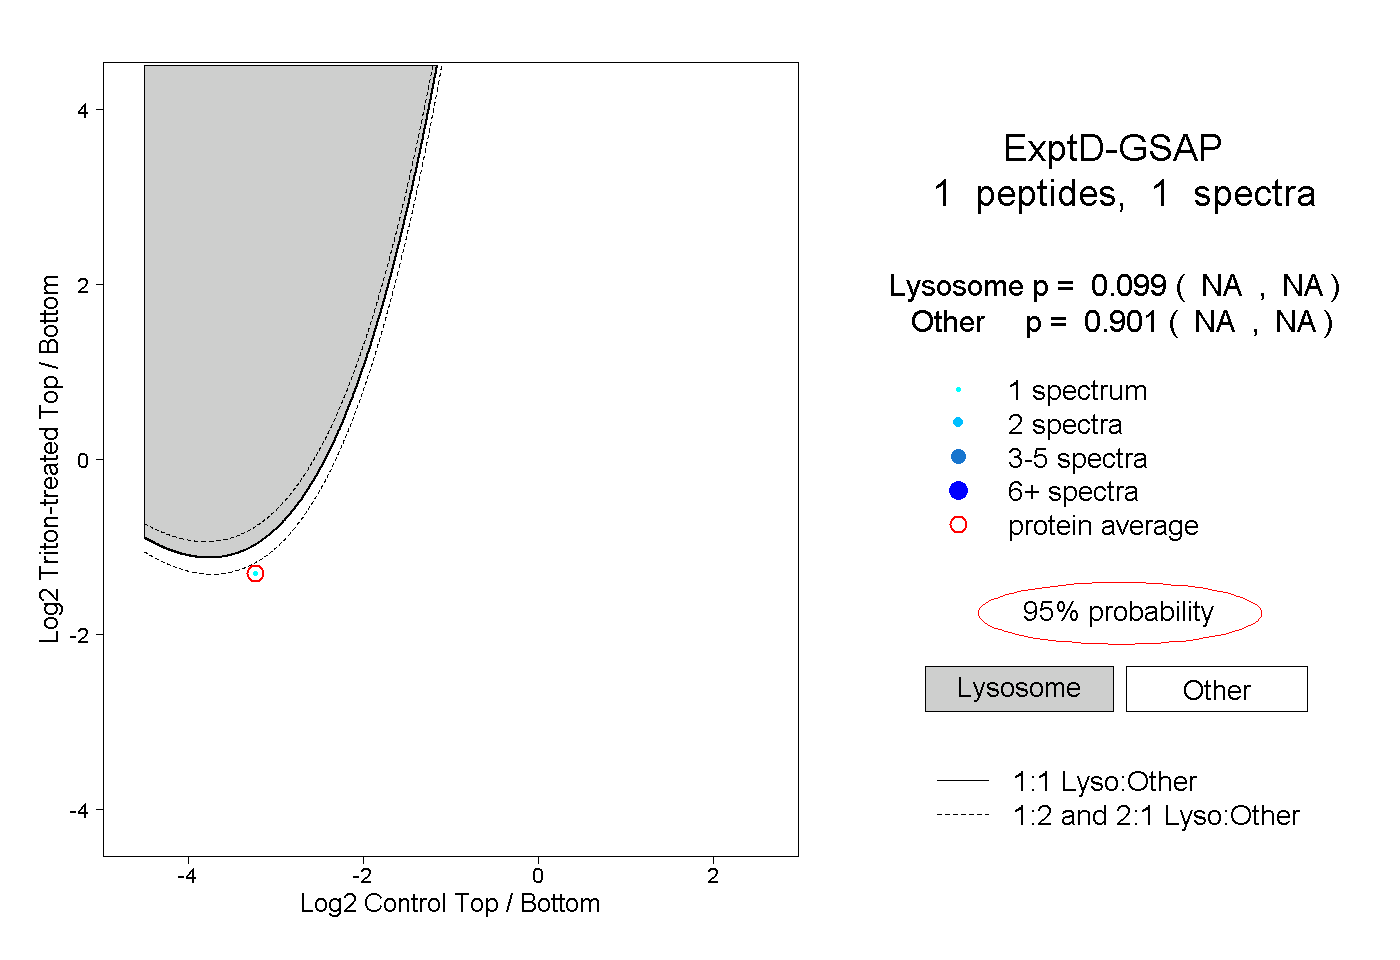
NA | NA
NA | NA