 3
3peptides
spectra
0.000 | 0.000
0.513 | 0.625
0.000 | 0.000
0.000 | 0.000
0.000 | 0.021
0.089 | 0.215
0.225 | 0.293
0.000 | 0.000
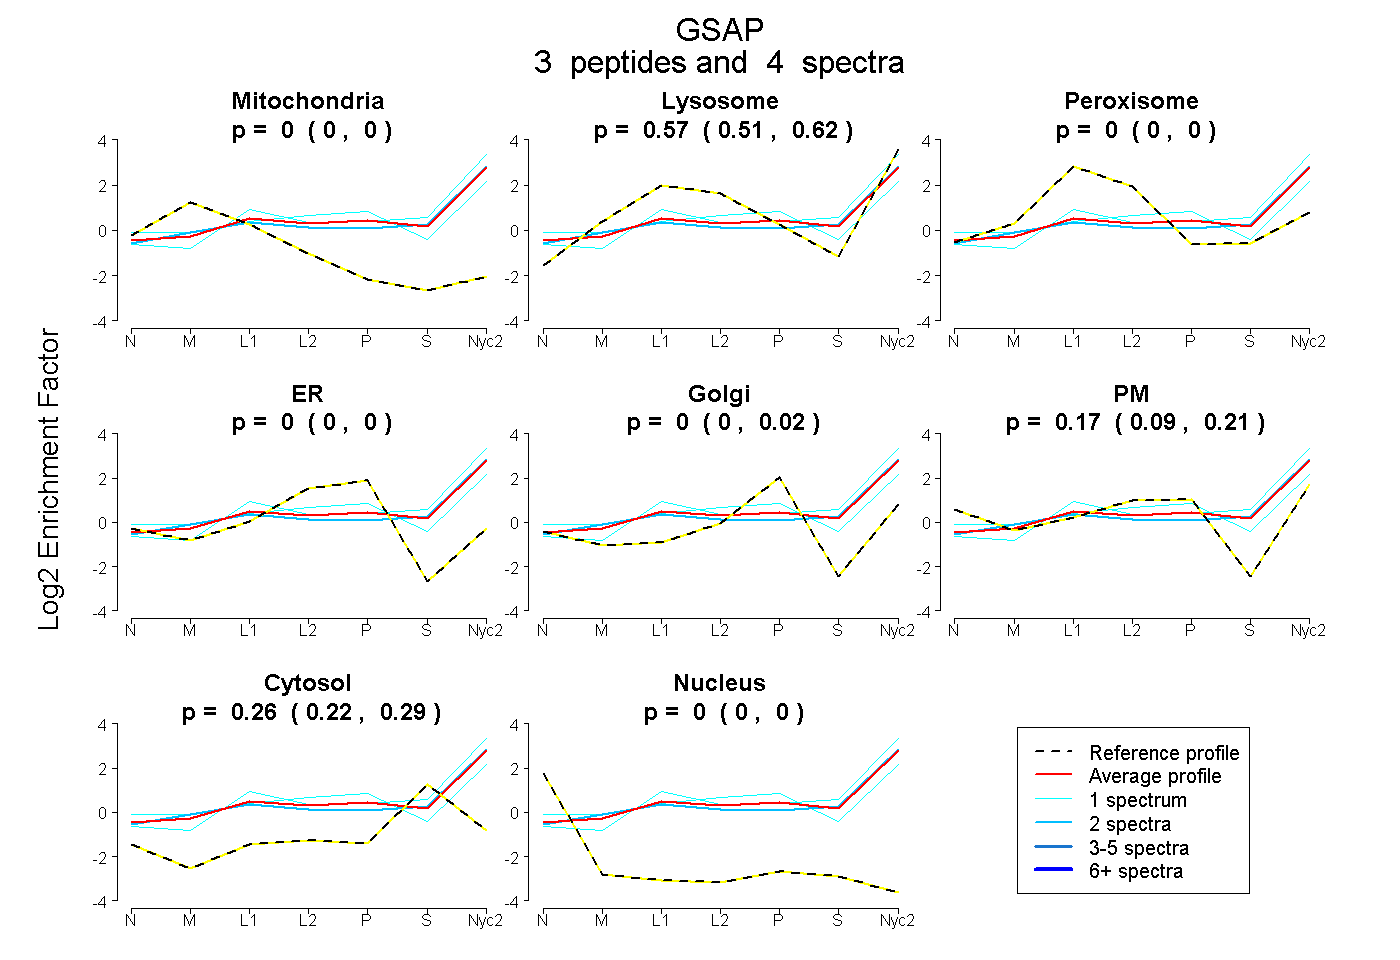
| Plot | Mito | Lyso | Perox | ER | Golgi | PM | Cytosol | Nucleus | |||||
| Expt A |
3 peptides |
4 spectra |
|
0.000 0.000 | 0.000 |
0.573 0.513 | 0.625 |
0.000 0.000 | 0.000 |
0.000 0.000 | 0.000 |
0.000 0.000 | 0.021 |
0.166 0.089 | 0.215 |
0.261 0.225 | 0.293 |
0.000 0.000 | 0.000 |
| 1 spectrum, LIPLLQEEDR | 0.000 | 0.723 | 0.000 | 0.000 | 0.000 | 0.000 | 0.277 | 0.000 | ||
| 1 spectrum, ENEHLYTFEK | 0.000 | 0.377 | 0.000 | 0.000 | 0.000 | 0.433 | 0.189 | 0.000 | ||
| 2 spectra, FHIQITR | 0.000 | 0.606 | 0.000 | 0.000 | 0.000 | 0.095 | 0.299 | 0.000 |
| Plot | Lyso | Other | |||||||||||
| Expt C |
16 peptides |
39 spectra |
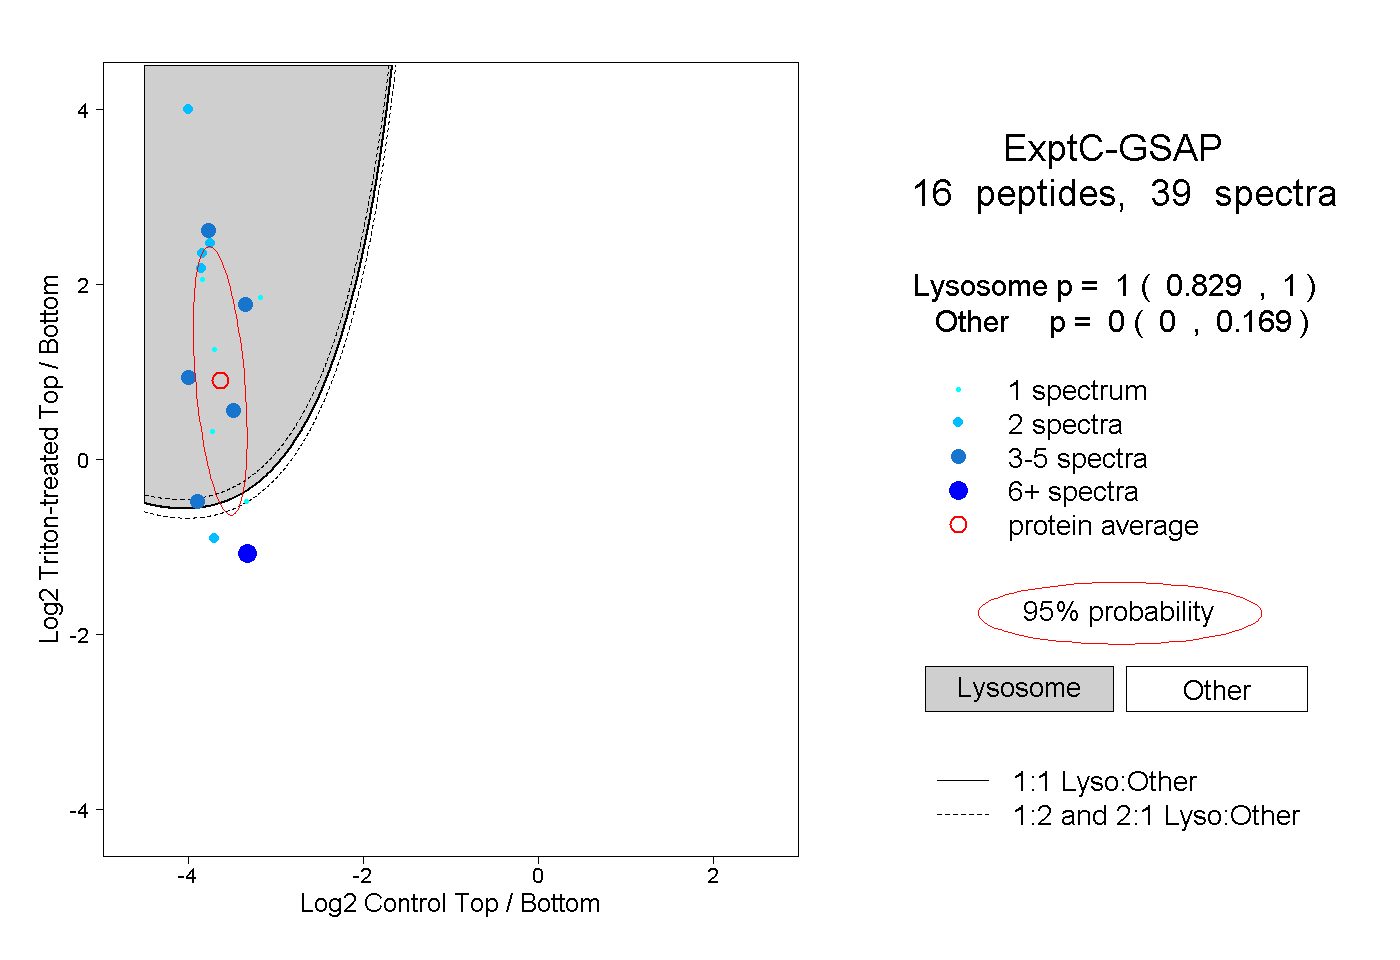 |
1.000 0.829 | 1.000 |
0.000 0.000 | 0.169 |
||||||||
| Plot | Lyso | Other | |||||||||||
| Expt D |
1 peptide |
1 spectrum |
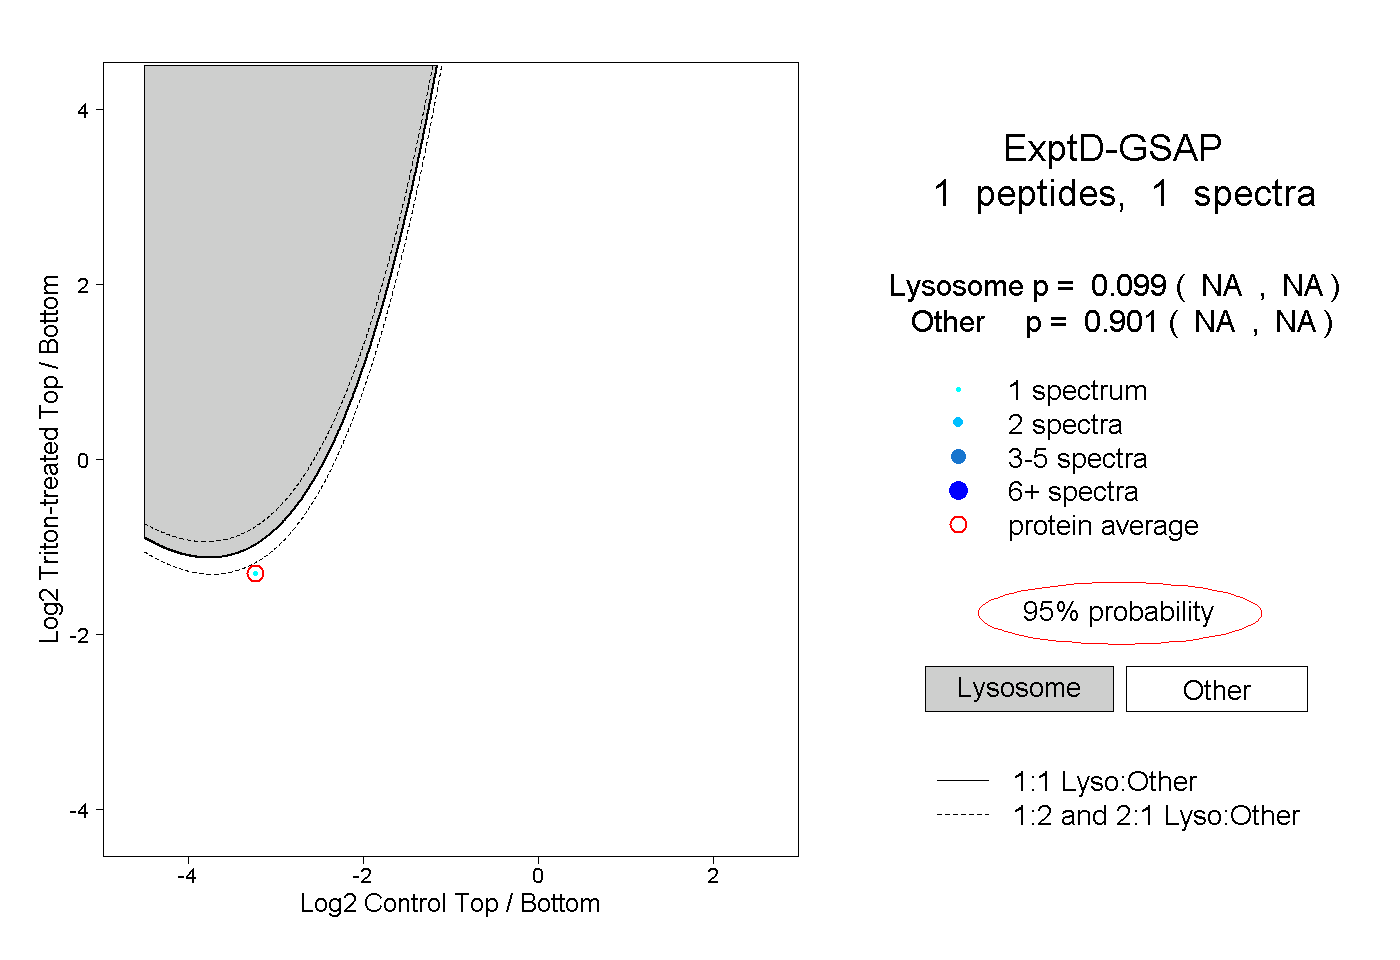 |
0.099 NA | NA |
0.901 NA | NA |