 8
8peptides
spectra
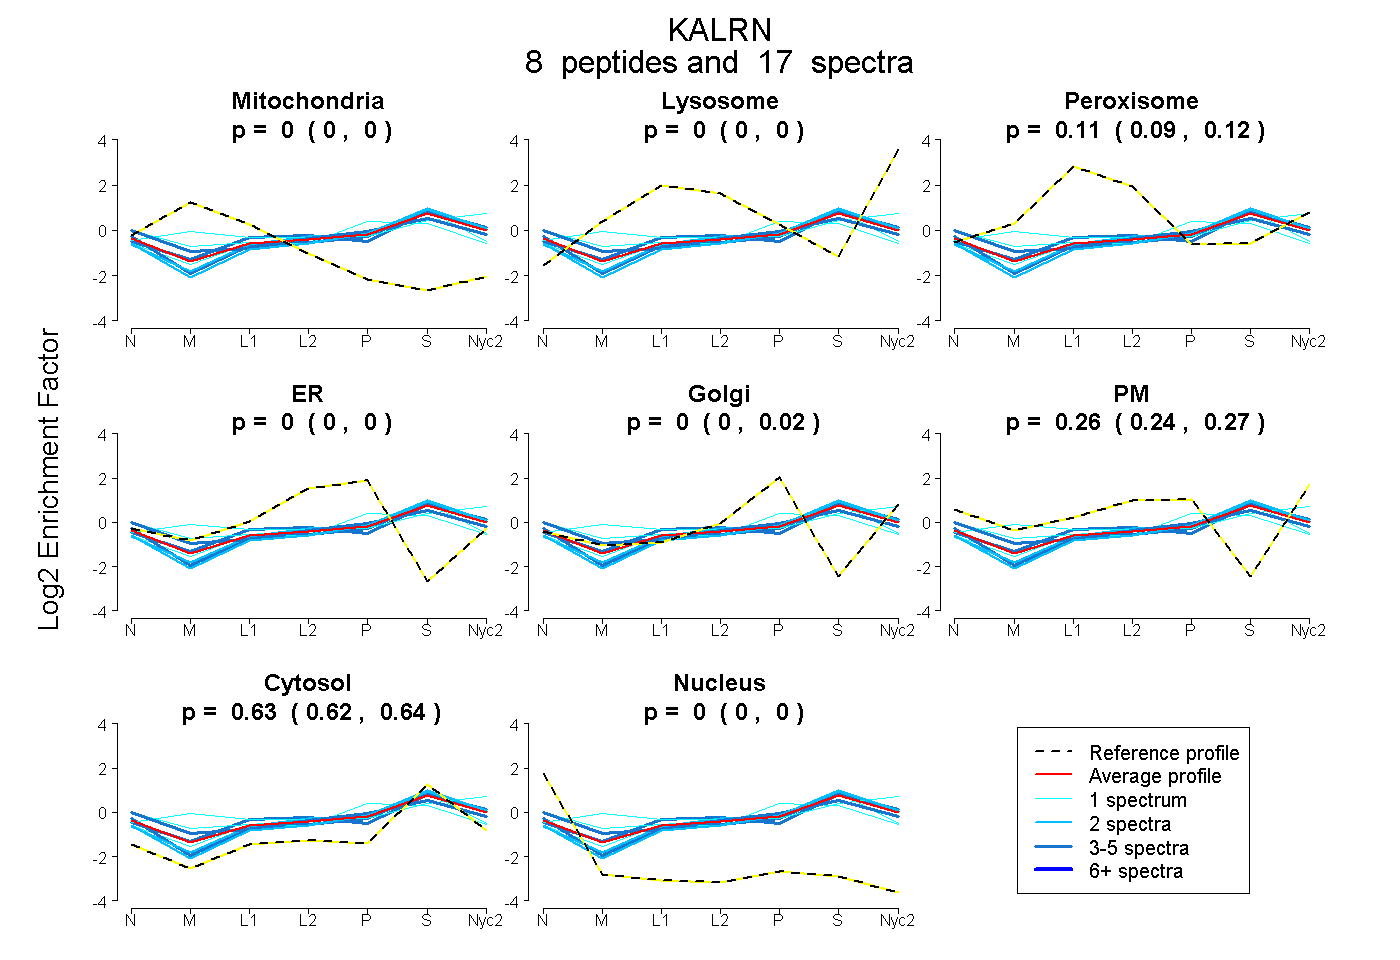
0.000 | 0.000
0.000 | 0.000
0.095 | 0.118
0.000 | 0.000
0.000 | 0.015
0.239 | 0.271
0.621 | 0.637
0.000 | 0.000
2peptides
spectra
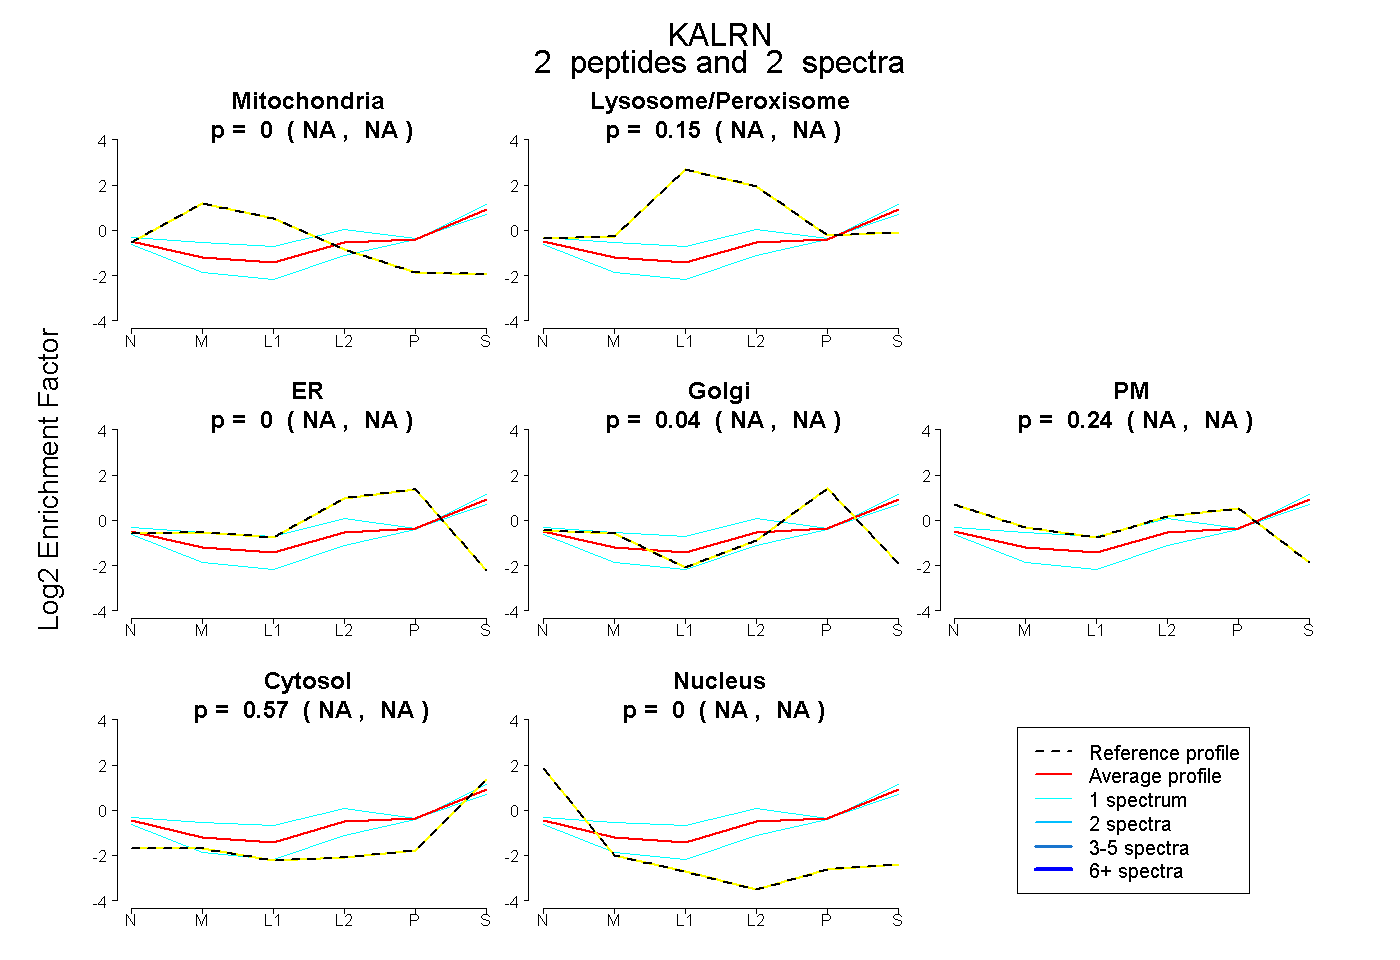
NA | NA
NA | NA
NA | NA
NA | NA
NA | NA
NA | NA
NA | NA
8peptides
spectra
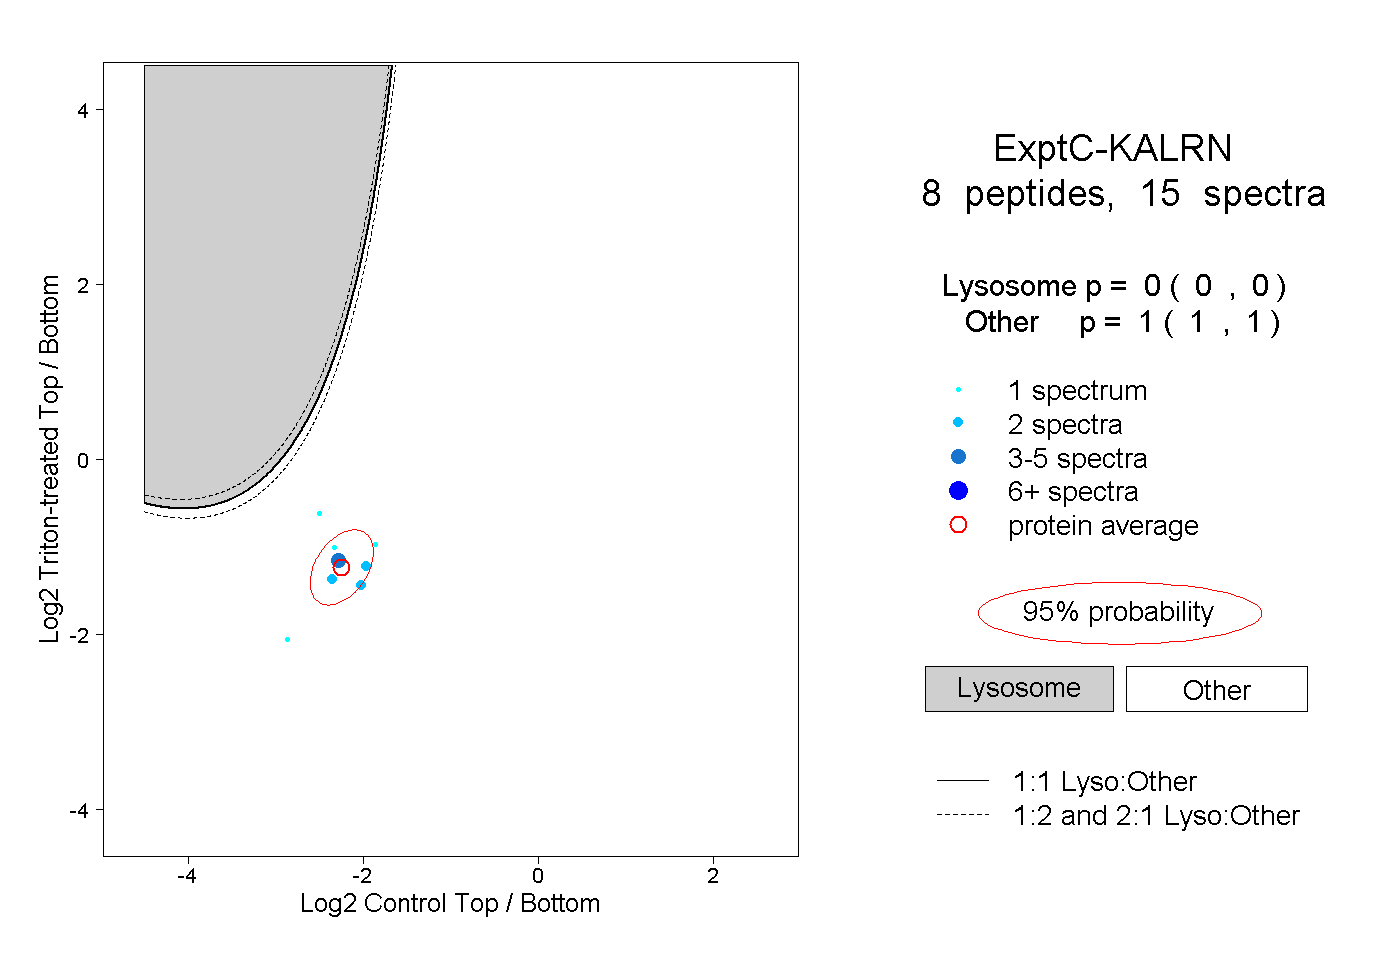
0.000 | 0.000
1.000 | 1.000
3peptides
spectra
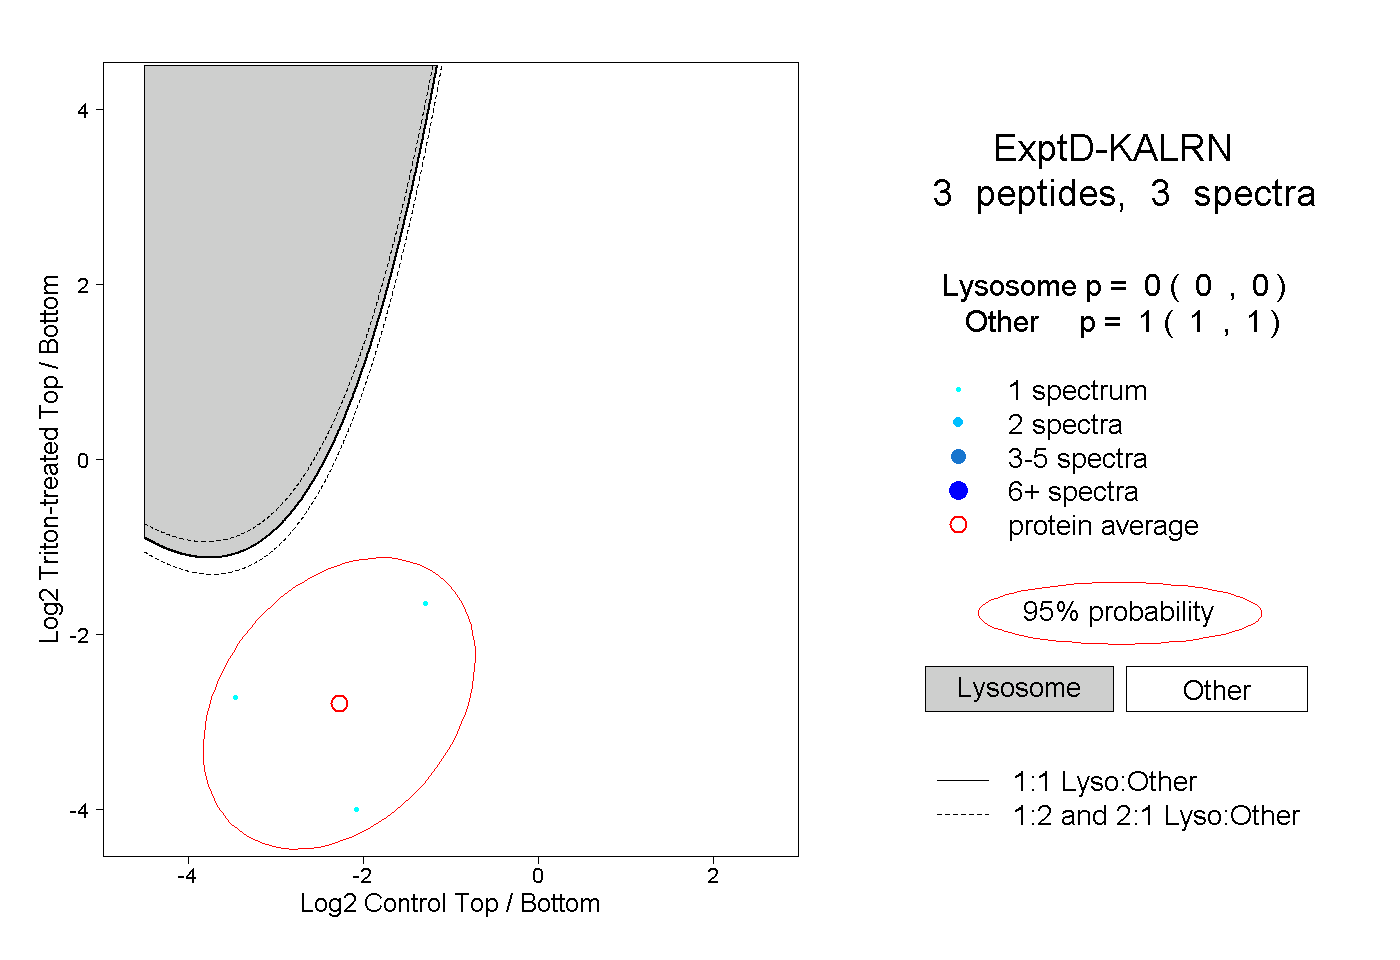
0.000 | 0.000
1.000 | 1.000