 8
8peptides
spectra
0.000 | 0.000
0.000 | 0.000
0.095 | 0.118
0.000 | 0.000
0.000 | 0.015
0.239 | 0.271
0.621 | 0.637
0.000 | 0.000
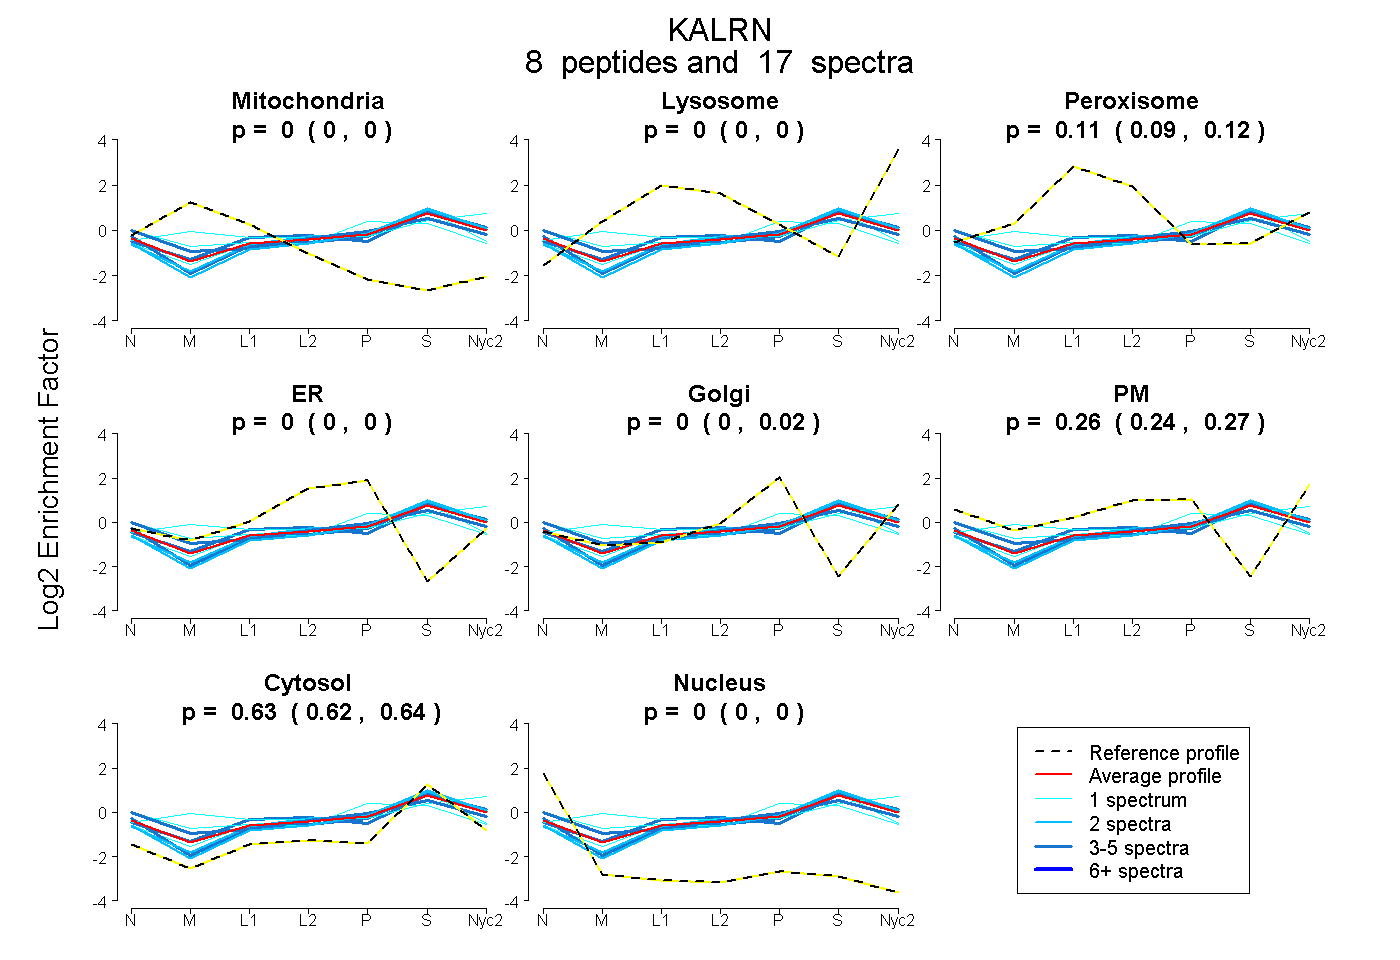
| Plot | Mito | Lyso | Perox | ER | Golgi | PM | Cytosol | Nucleus | |||||
| Expt A |
8 peptides |
17 spectra |
|
0.000 0.000 | 0.000 |
0.000 0.000 | 0.000 |
0.106 0.095 | 0.118 |
0.000 0.000 | 0.000 |
0.000 0.000 | 0.015 |
0.263 0.239 | 0.271 |
0.630 0.621 | 0.637 |
0.000 0.000 | 0.000 |
| 1 spectrum, IVFGNIHQIYDWHK | 0.098 | 0.250 | 0.018 | 0.000 | 0.000 | 0.176 | 0.458 | 0.000 | ||
| 1 spectrum, EFIMAELLQTEK | 0.078 | 0.000 | 0.141 | 0.025 | 0.294 | 0.007 | 0.456 | 0.000 | ||
| 2 spectra, DLGIVVEGFMK | 0.000 | 0.037 | 0.088 | 0.000 | 0.024 | 0.175 | 0.675 | 0.000 | ||
| 3 spectra, LFEQDAEK | 0.020 | 0.000 | 0.058 | 0.000 | 0.000 | 0.341 | 0.582 | 0.000 | ||
| 1 spectrum, AVELMCLVPK | 0.000 | 0.000 | 0.166 | 0.101 | 0.086 | 0.000 | 0.647 | 0.000 | ||
| 4 spectra, AGLECSDIEK | 0.000 | 0.009 | 0.210 | 0.000 | 0.000 | 0.171 | 0.610 | 0.000 | ||
| 2 spectra, LTLSDFLIKPIQR | 0.000 | 0.037 | 0.000 | 0.000 | 0.009 | 0.228 | 0.726 | 0.000 | ||
| 3 spectra, DFFLAELEK | 0.000 | 0.000 | 0.054 | 0.000 | 0.000 | 0.256 | 0.690 | 0.000 |
| Plot | Mito | Lyso or Perox | ER | Golgi | PM | Cytosol | Nucleus | ||||||
| Expt B |
2 peptides |
2 spectra |
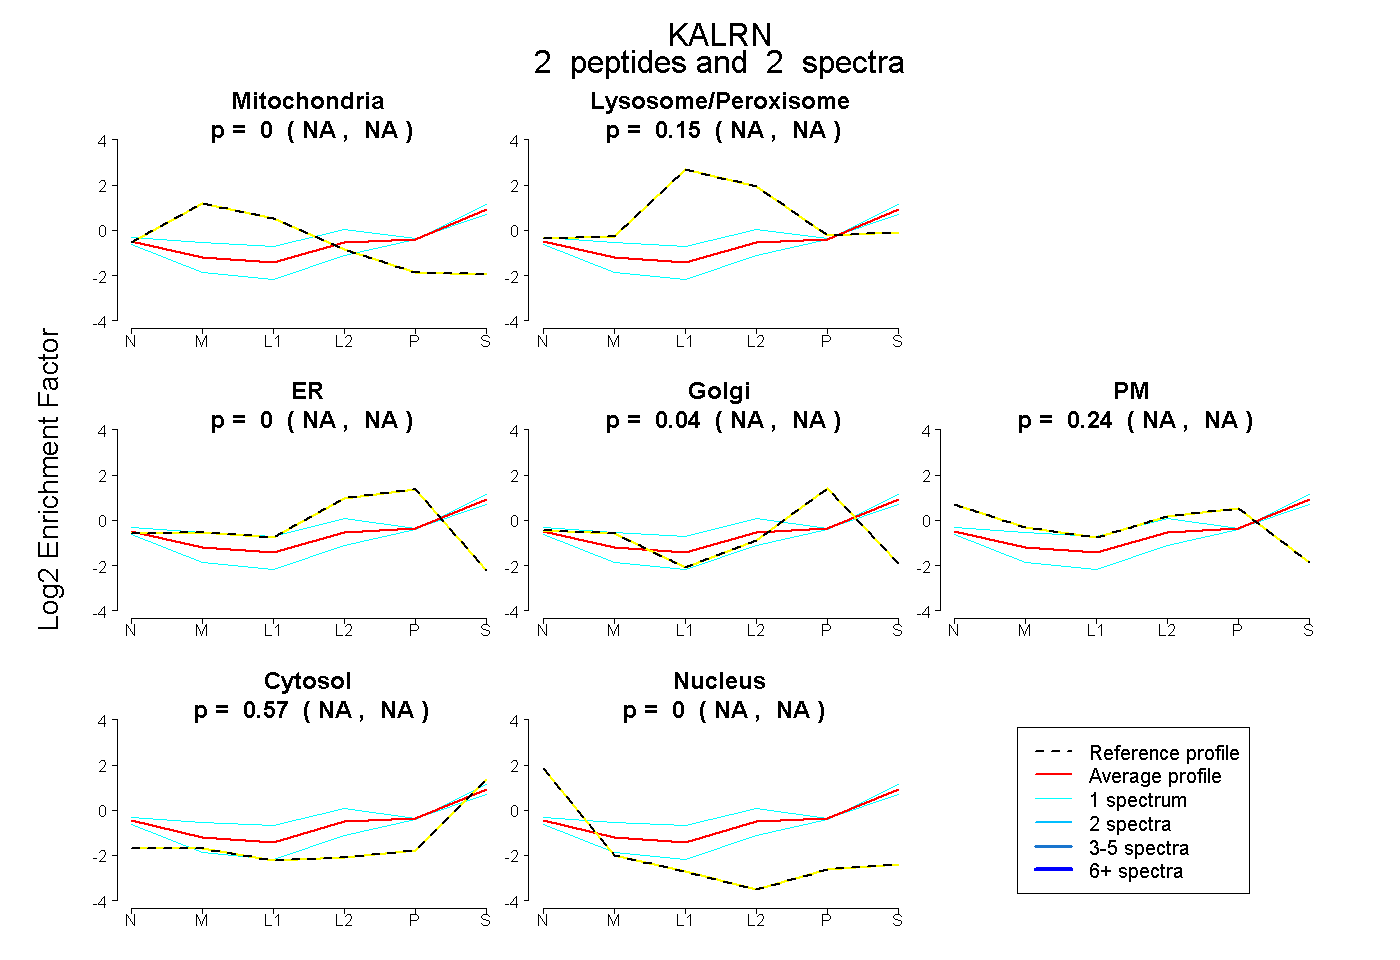 |
0.000 NA | NA |
0.155 NA | NA |
0.000 NA | NA |
0.039 NA | NA |
0.239 NA | NA |
0.567 NA | NA |
0.000 NA | NA |
|||
| Plot | Lyso | Other | |||||||||||
| Expt C |
8 peptides |
15 spectra |
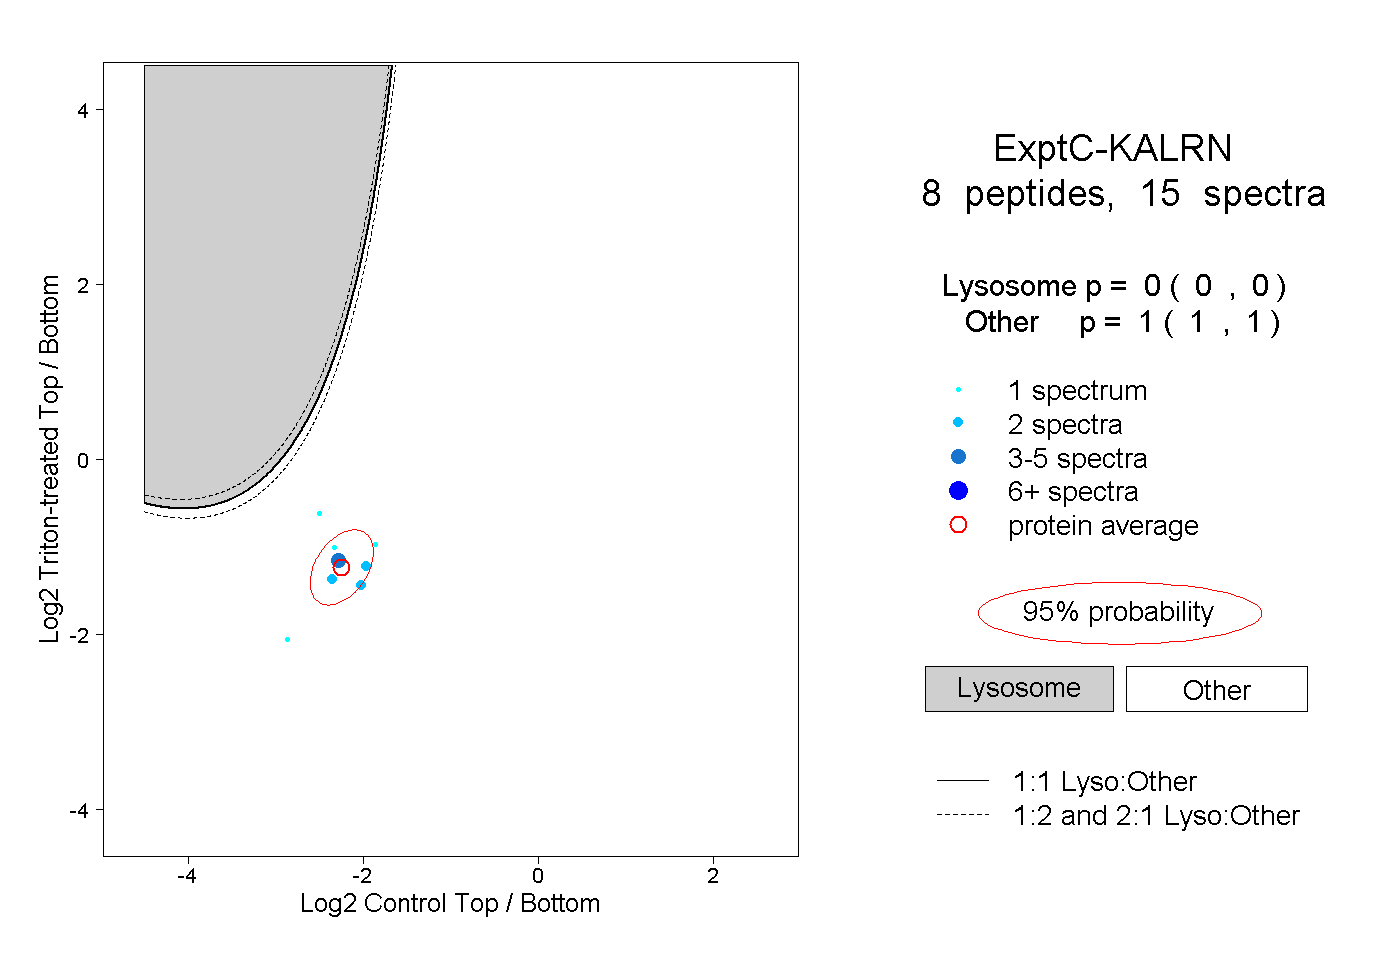 |
0.000 0.000 | 0.000 |
1.000 1.000 | 1.000 |
||||||||
| Plot | Lyso | Other | |||||||||||
| Expt D |
3 peptides |
3 spectra |
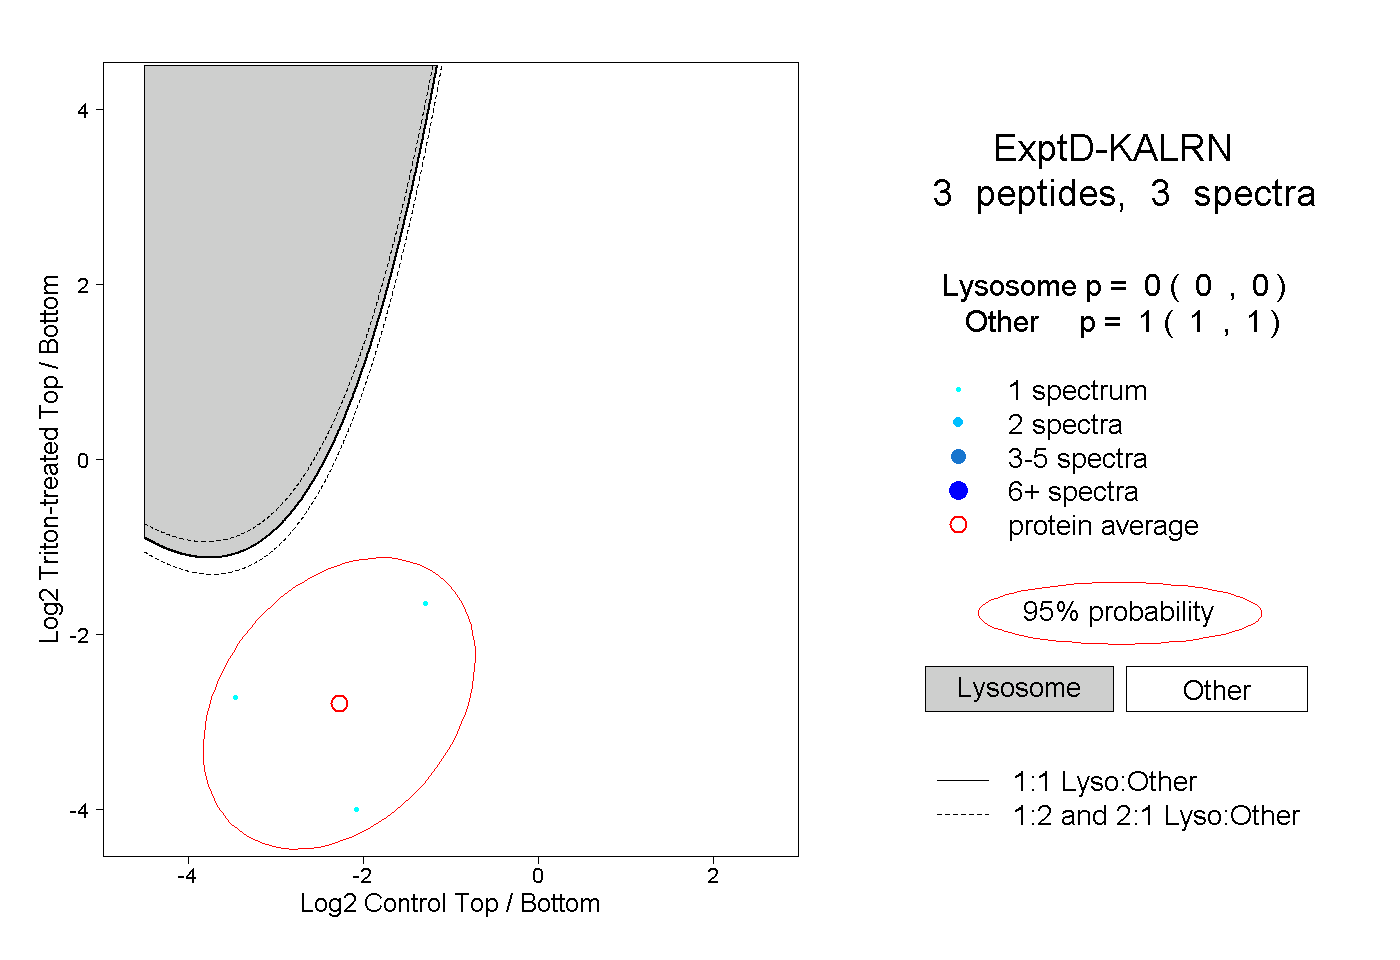 |
0.000 0.000 | 0.000 |
1.000 1.000 | 1.000 |