 2
2peptides
spectra
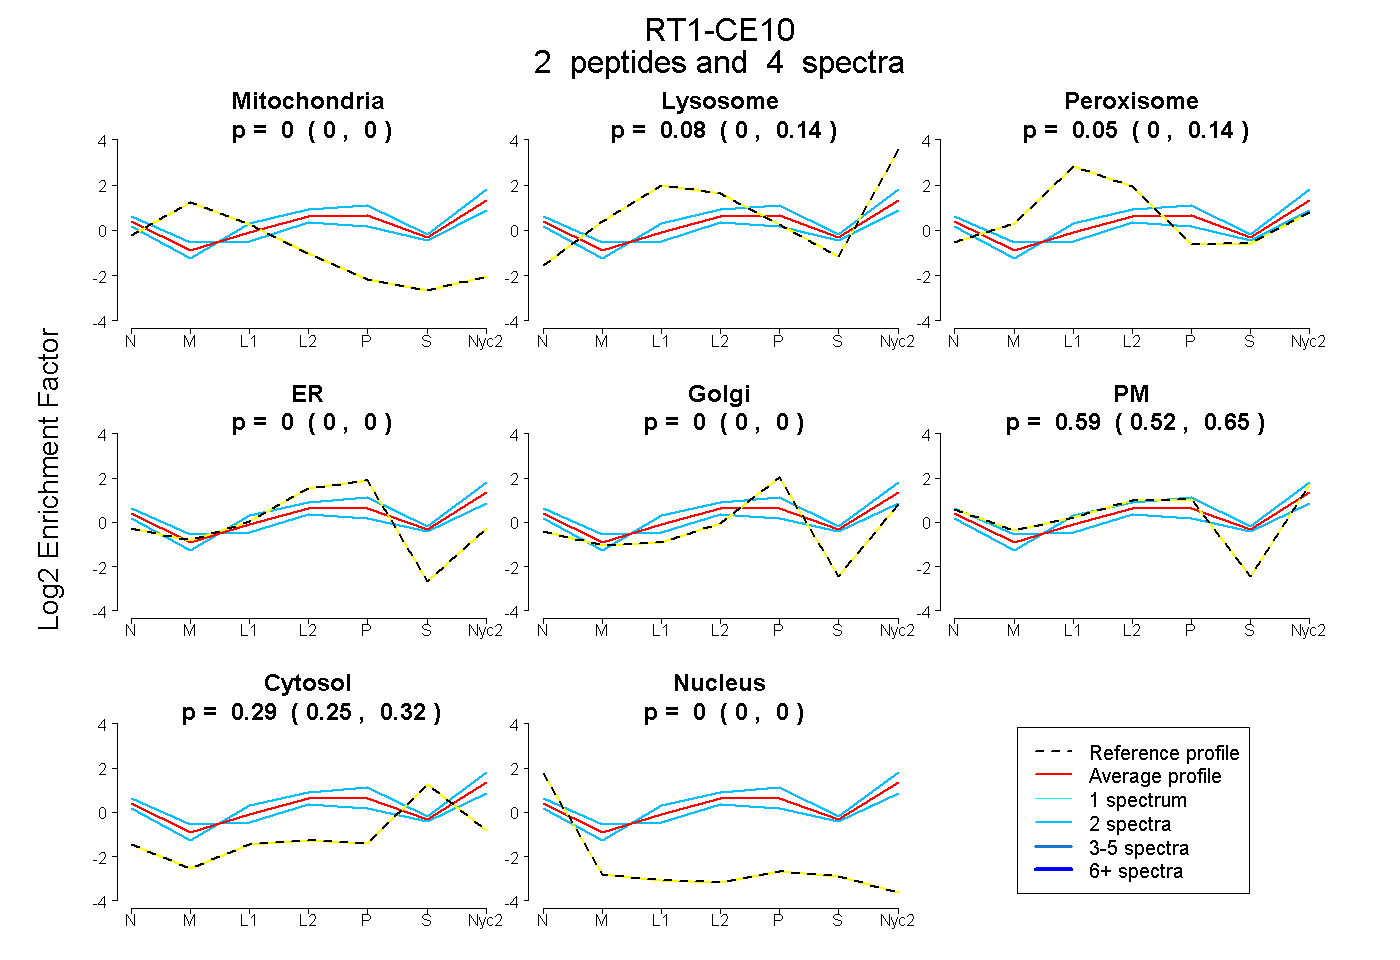
0.000 | 0.000
0.000 | 0.135
0.000 | 0.136
0.000 | 0.000
0.000 | 0.000
0.516 | 0.645
0.250 | 0.319
0.000 | 0.000
1peptide
spectrum
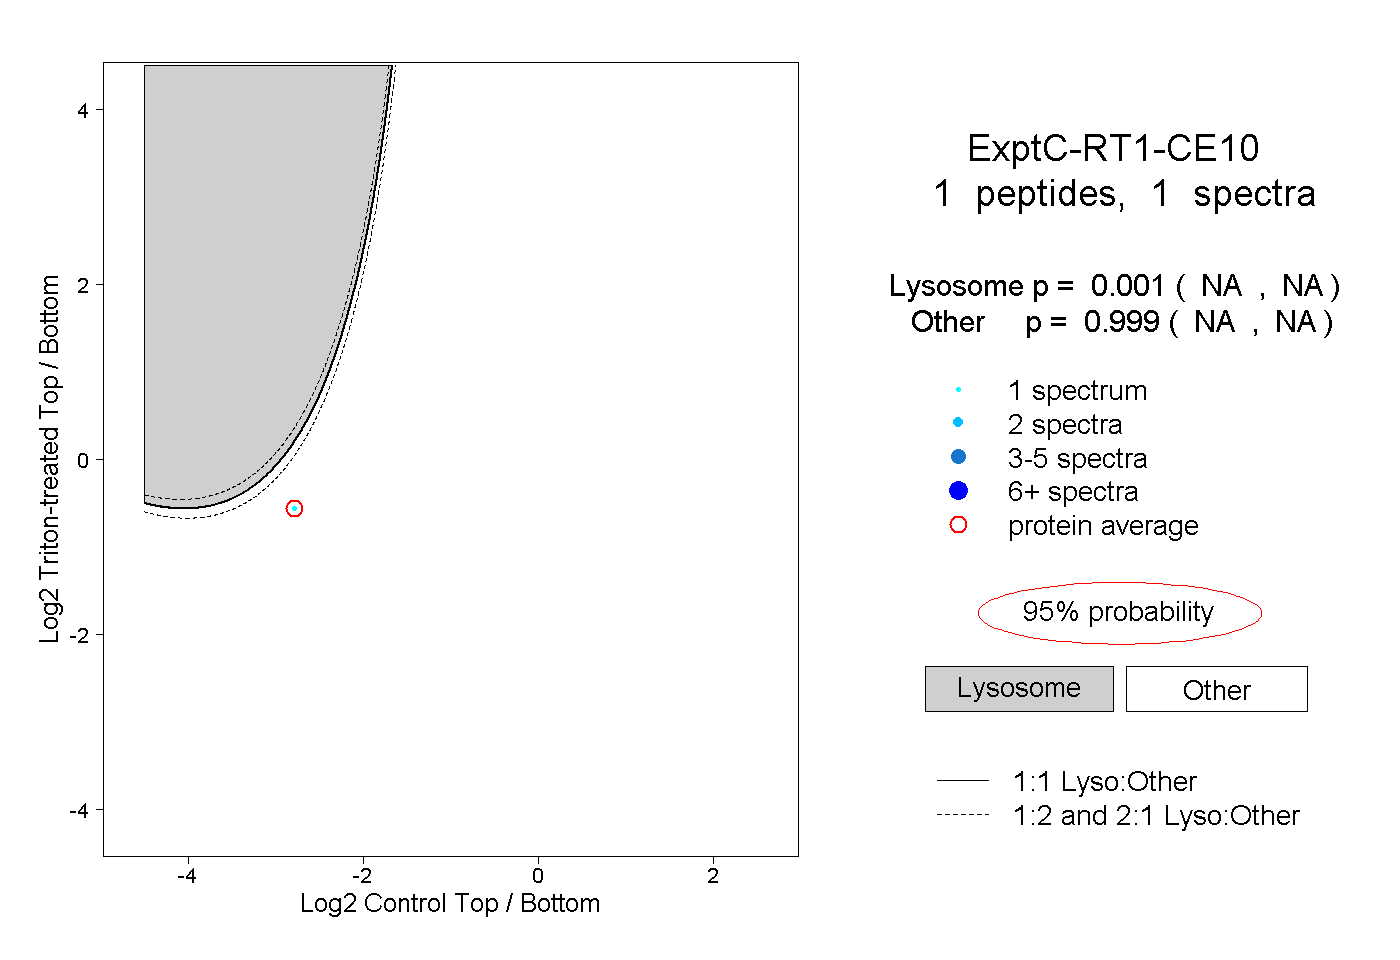
NA | NA
NA | NA
1peptide
spectrum
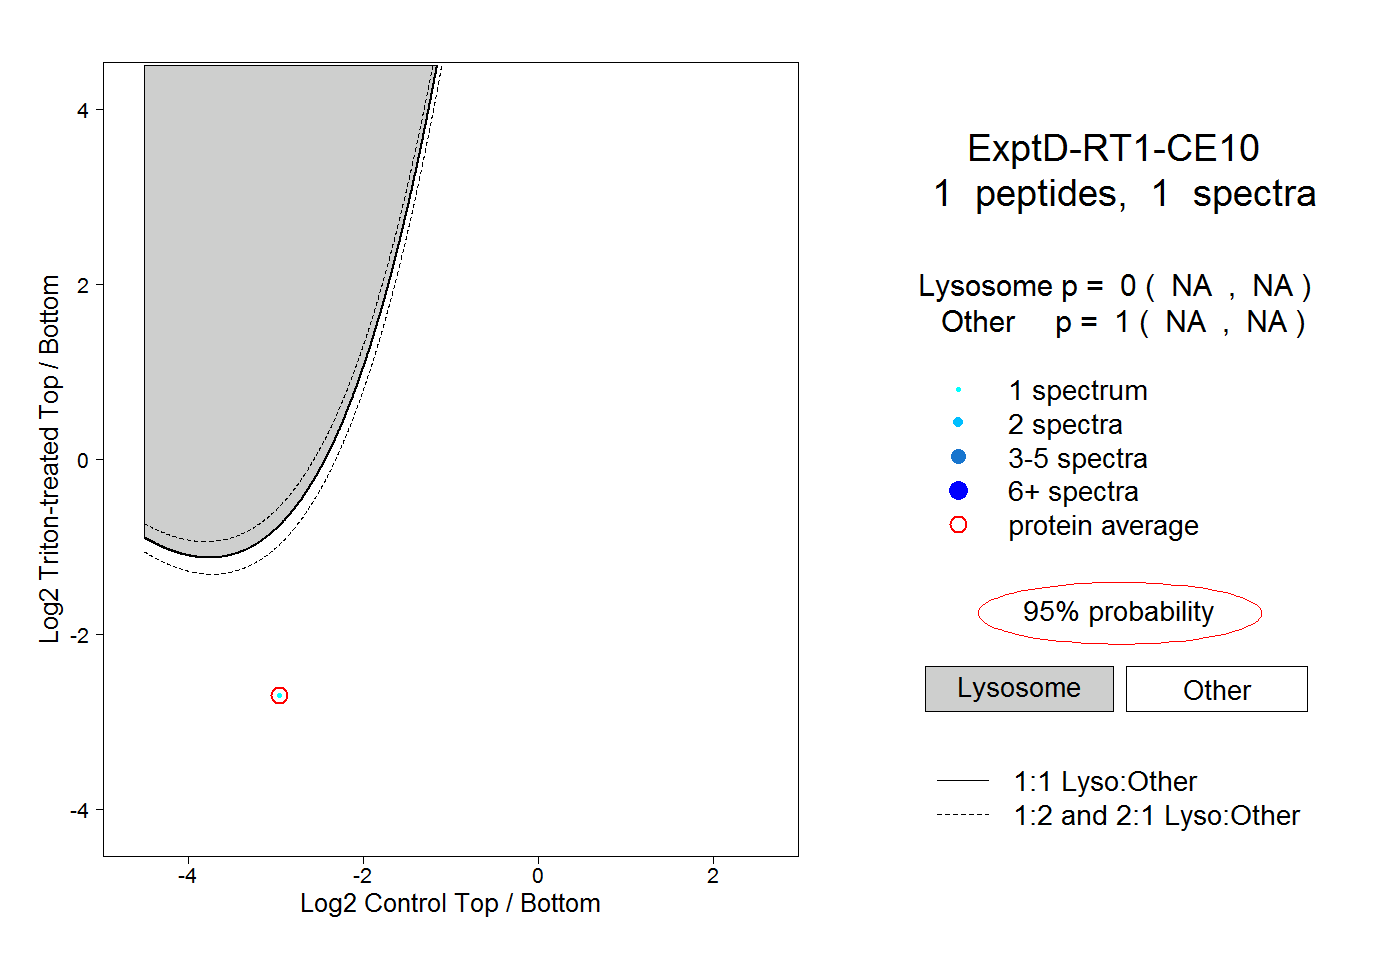
NA | NA
NA | NA