 2
2peptides
spectra
0.000 | 0.000
0.000 | 0.135
0.000 | 0.136
0.000 | 0.000
0.000 | 0.000
0.516 | 0.645
0.250 | 0.319
0.000 | 0.000
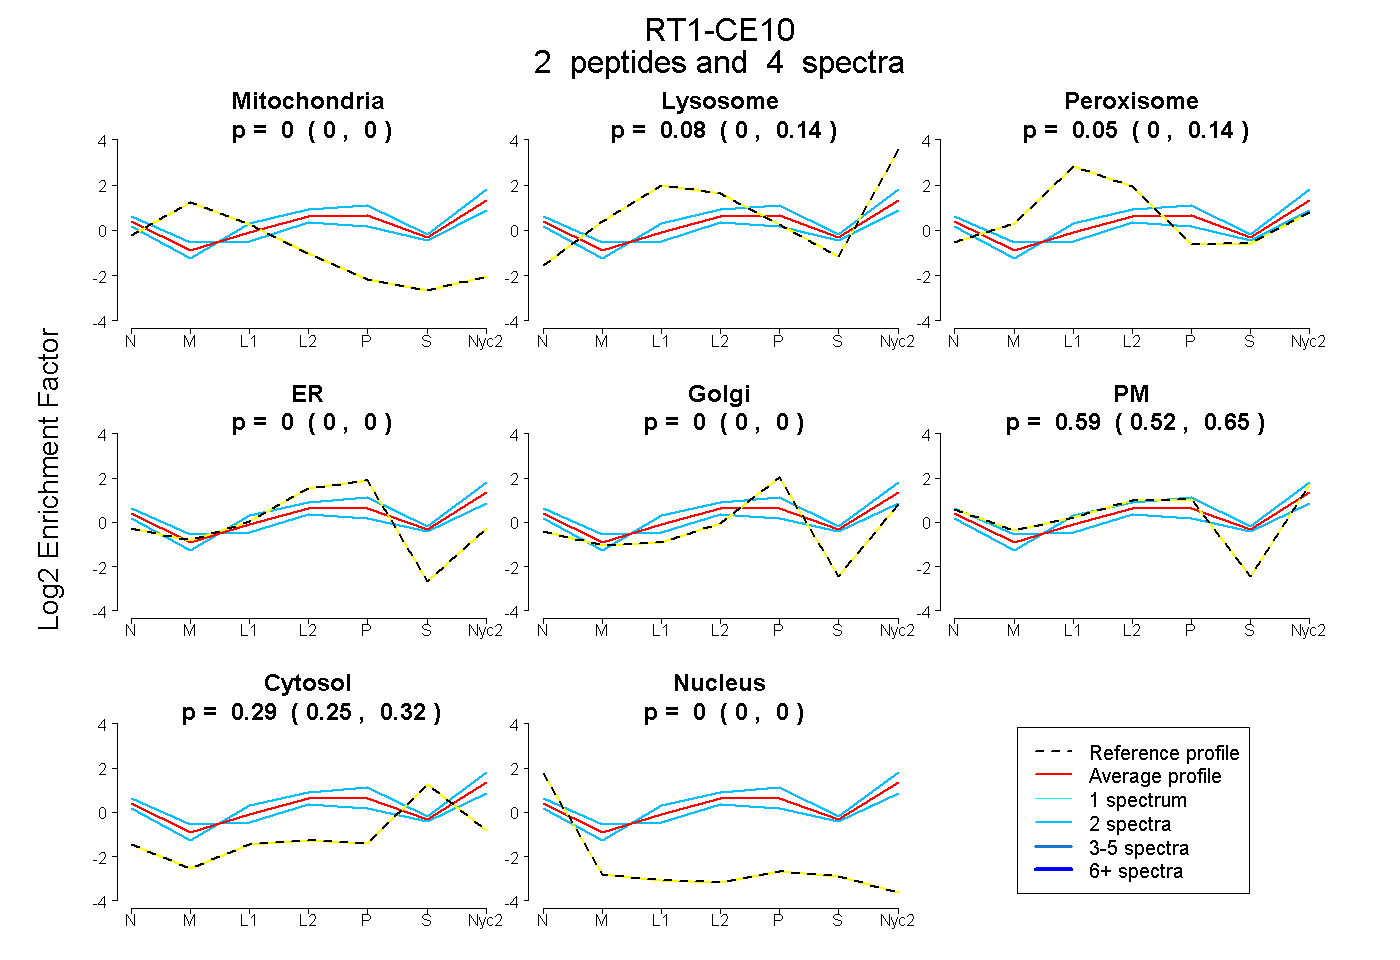
| Plot | Mito | Lyso | Perox | ER | Golgi | PM | Cytosol | Nucleus | |||||
| Expt A |
2 peptides |
4 spectra |
|
0.000 0.000 | 0.000 |
0.080 0.000 | 0.135 |
0.046 0.000 | 0.136 |
0.000 0.000 | 0.000 |
0.000 0.000 | 0.000 |
0.586 0.516 | 0.645 |
0.288 0.250 | 0.319 |
0.000 0.000 | 0.000 |
| 2 spectra, GYEQHAYDGR | 0.000 | 0.235 | 0.000 | 0.000 | 0.000 | 0.515 | 0.250 | 0.000 | ||
| 2 spectra, YFHTAVSRPGLGEPR | 0.000 | 0.000 | 0.055 | 0.000 | 0.000 | 0.613 | 0.333 | 0.000 |
| Plot | Lyso | Other | |||||||||||
| Expt C |
1 peptide |
1 spectrum |
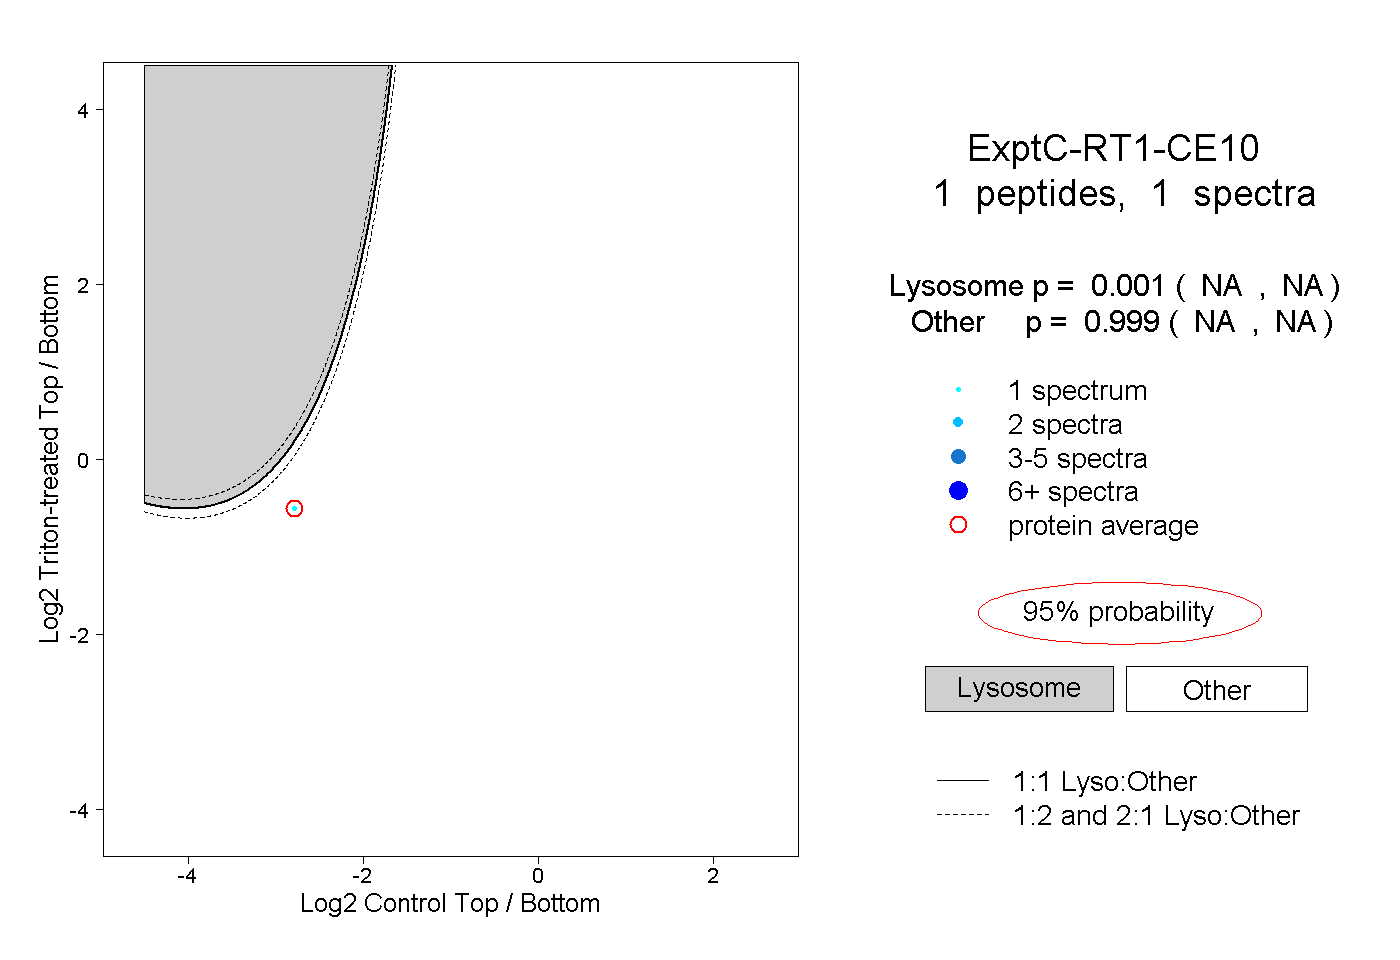 |
0.001 NA | NA |
0.999 NA | NA |
||||||||
| Plot | Lyso | Other | |||||||||||
| Expt D |
1 peptide |
1 spectrum |
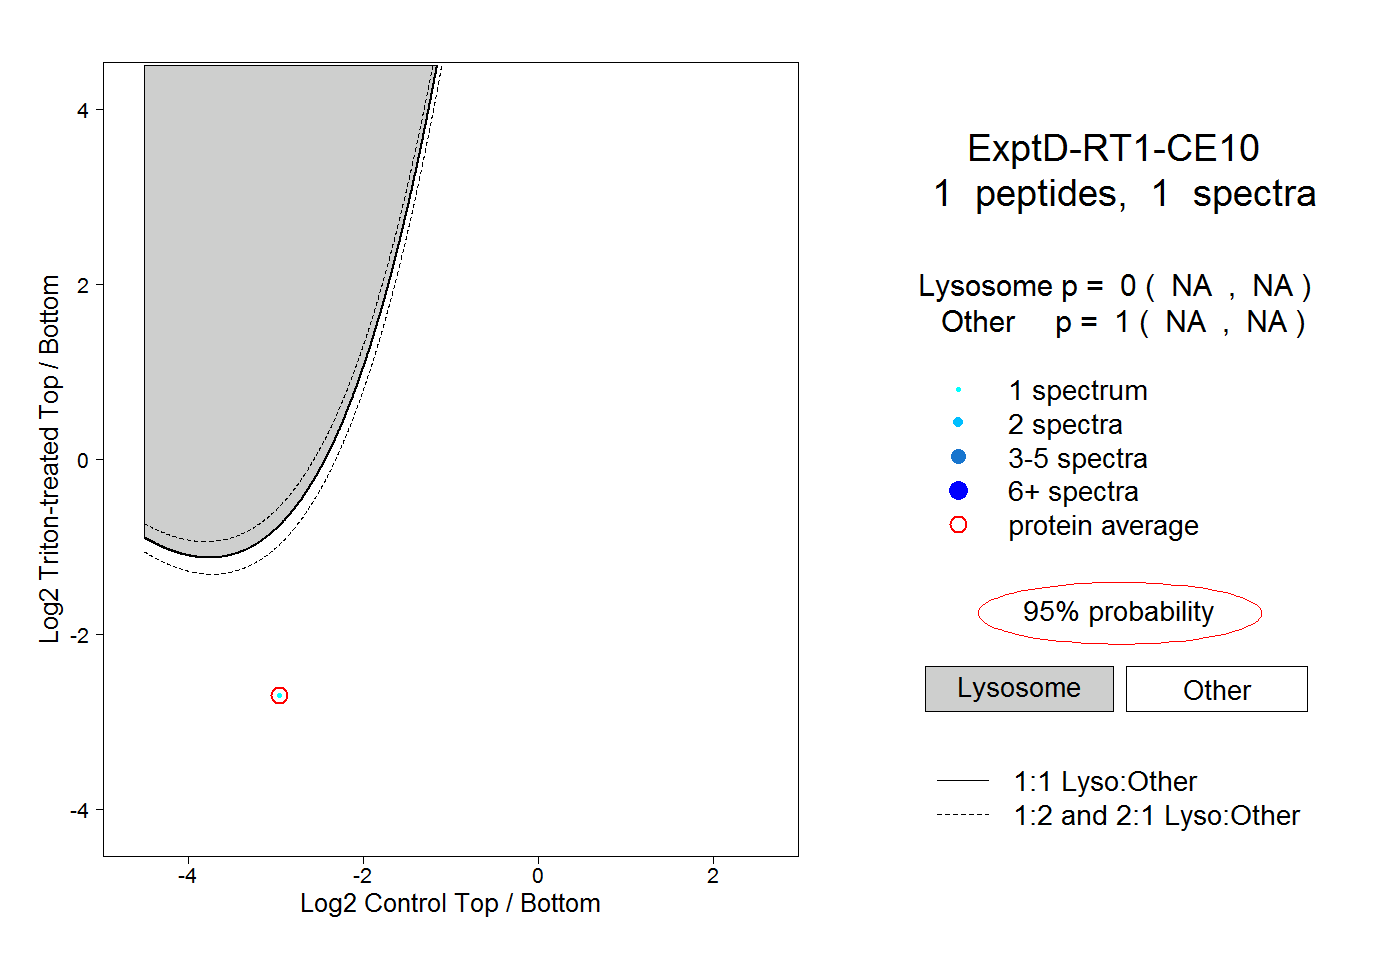 |
0.000 NA | NA |
1.000 NA | NA |