 10
10peptides
spectra
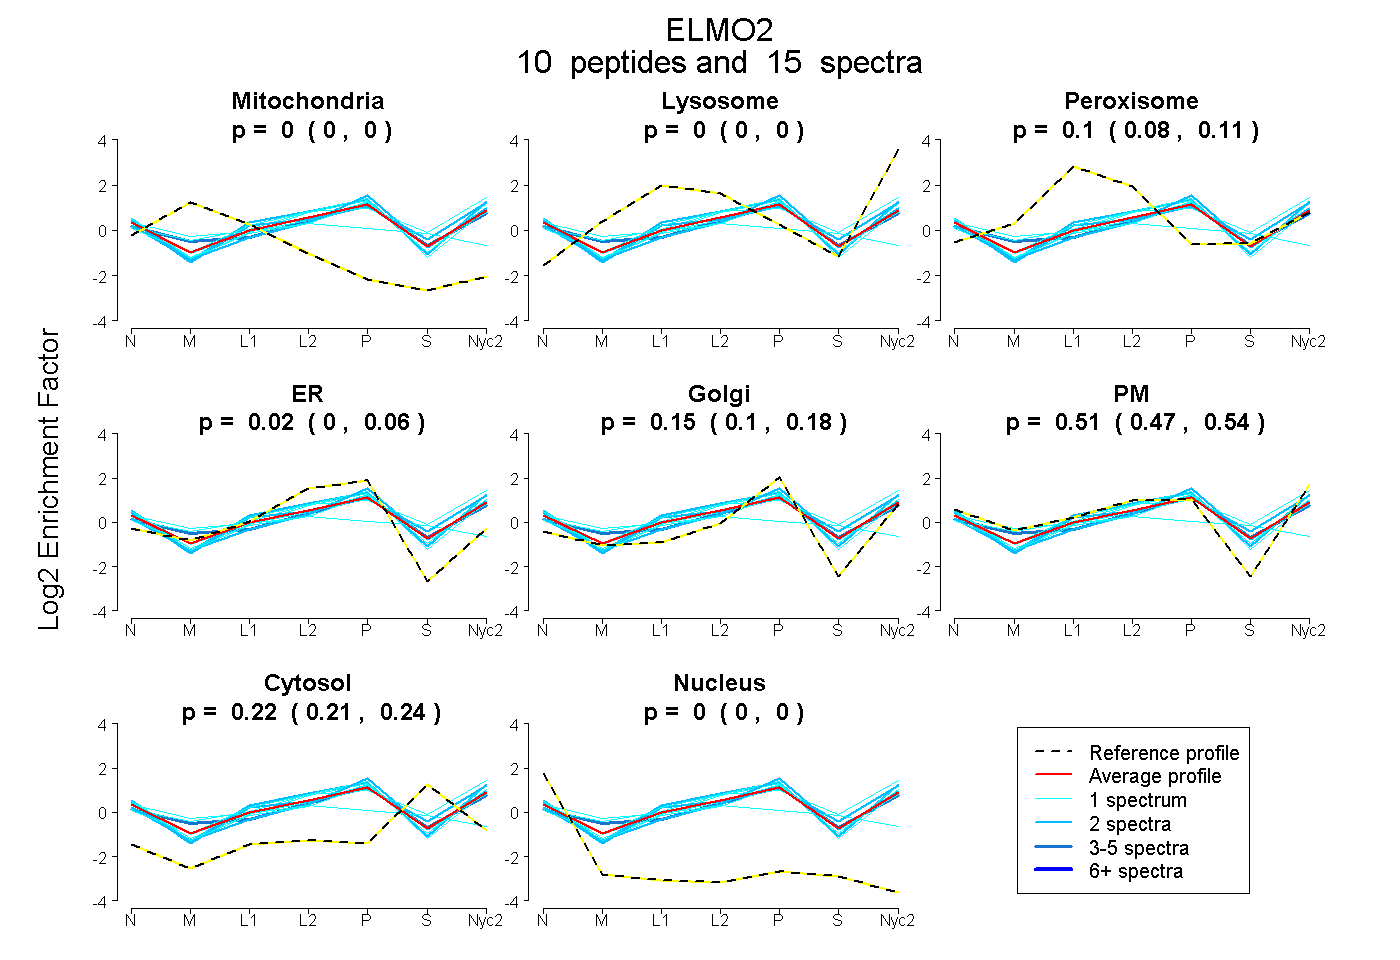
0.000 | 0.000
0.000 | 0.000
0.079 | 0.111
0.000 | 0.063
0.099 | 0.183
0.469 | 0.544
0.208 | 0.236
0.000 | 0.000
3peptides
spectra
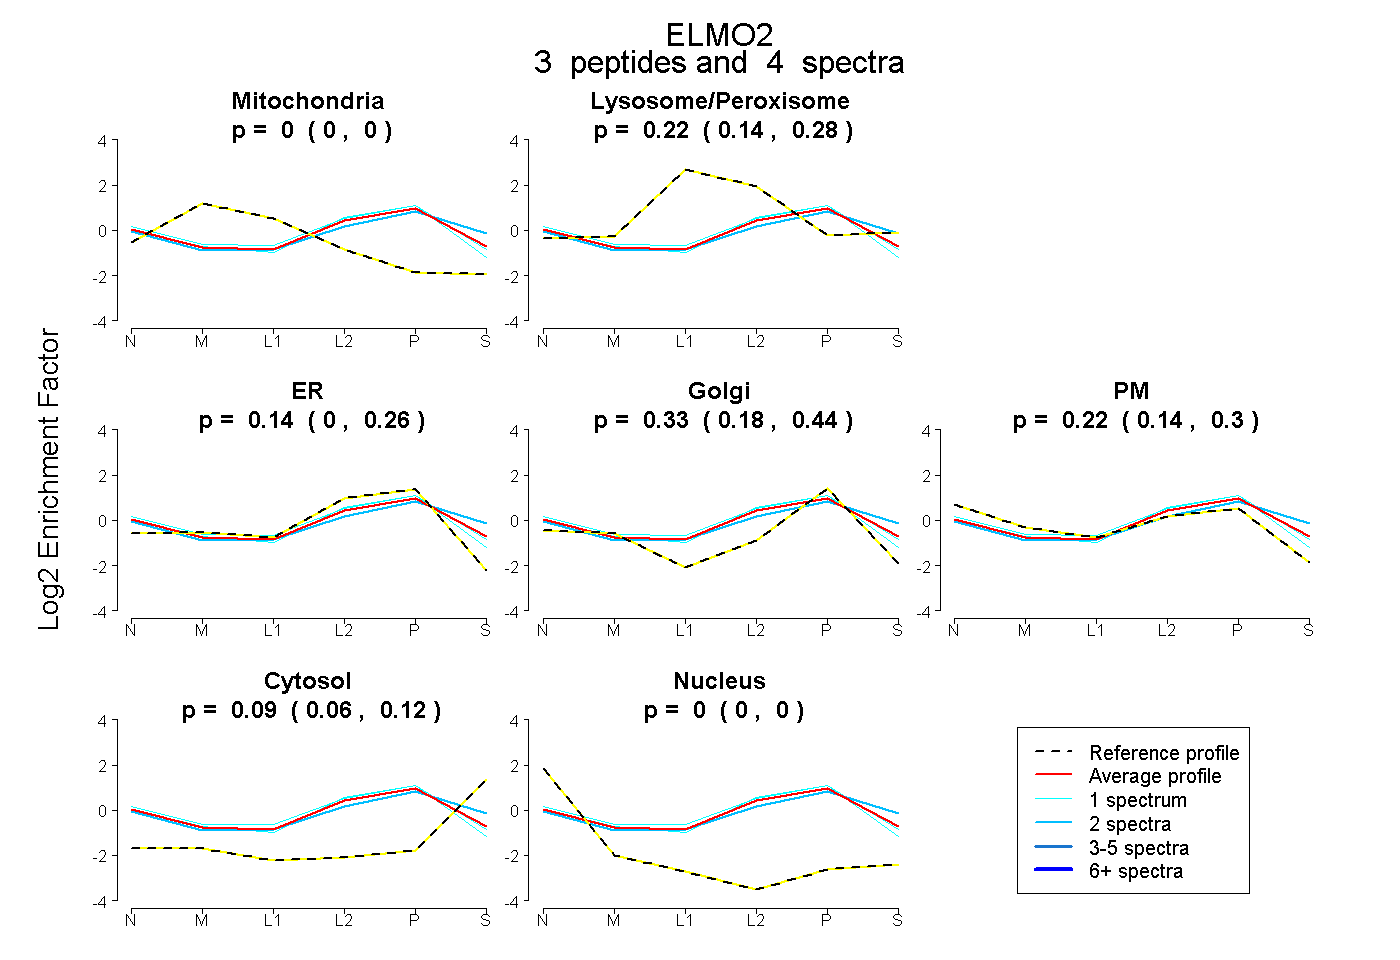
0.000 | 0.000
0.145 | 0.276
0.000 | 0.256
0.181 | 0.442
0.143 | 0.296
0.058 | 0.120
0.000 | 0.000
4peptides
spectra
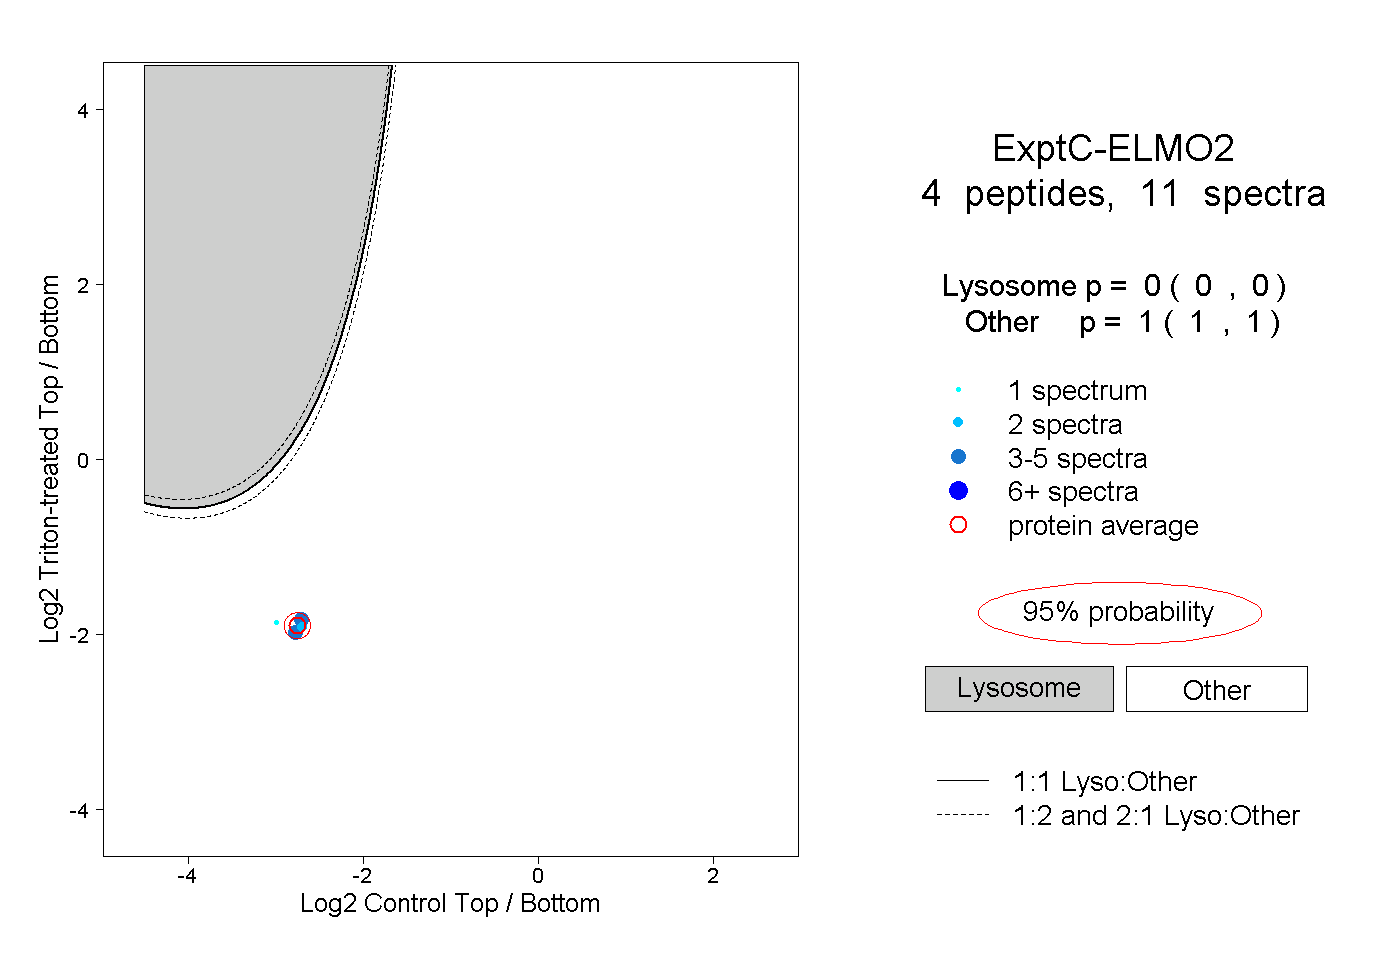
0.000 | 0.000
1.000 | 1.000