ELMO2
[ENSRNOP00000039023]
Main page
| | | Plot |
Mito |
Lyso |
|
Perox |
ER |
Golgi |
PM |
Cytosol |
Nucleus |
|
| Expt A |
 10
10
peptides |
15
spectra |
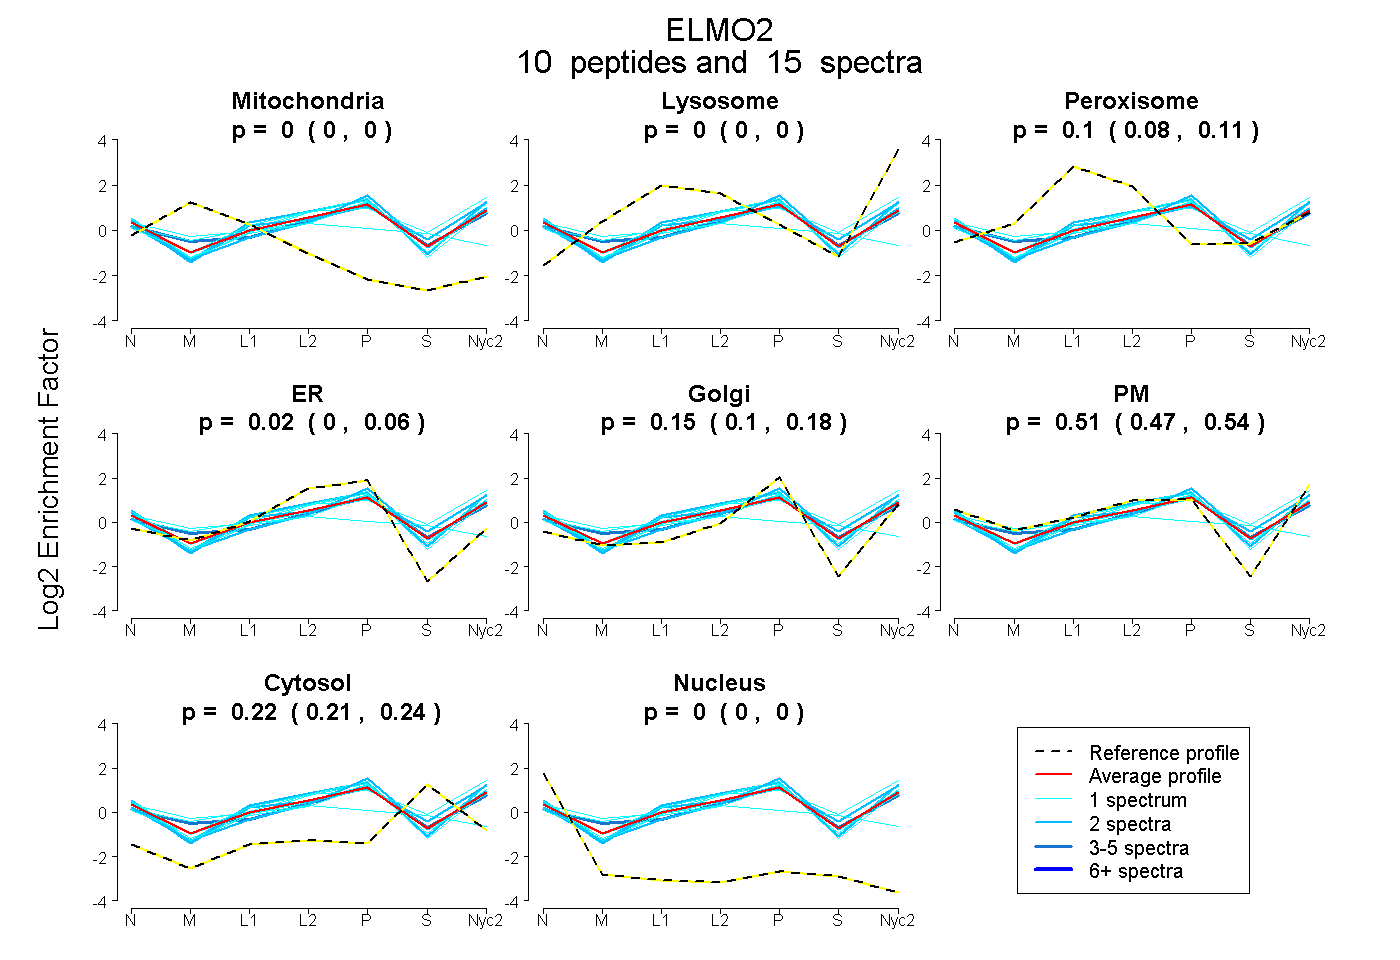 |
0.000
0.000 | 0.000 |
0.000
0.000 | 0.000 |
|
0.097
0.079 | 0.111 |
0.025
0.000 | 0.063 |
0.147
0.099 | 0.183 |
0.509
0.469 | 0.544 |
0.223
0.208 | 0.236 |
0.000
0.000 | 0.000 |
|
| | | Plot |
Mito |
|
Lyso or Perox |
|
ER |
Golgi |
PM |
Cytosol |
Nucleus |
|
| Expt B |
3
peptides |
4
spectra |
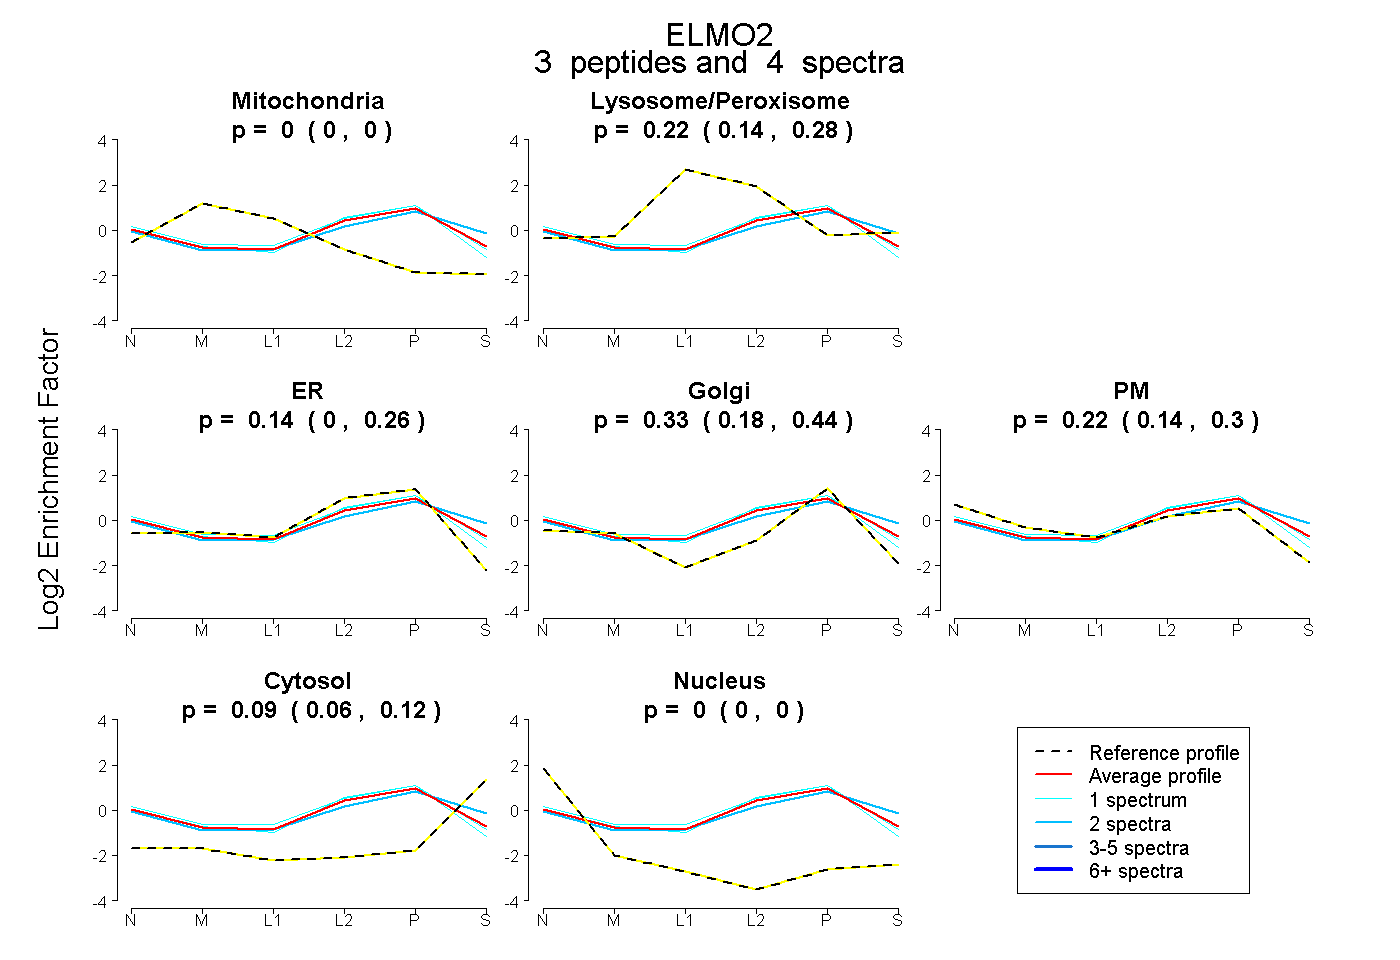 |
0.000
0.000 | 0.000 |
|
0.215
0.145 | 0.276 |
|
0.144
0.000 | 0.256 |
0.325
0.181 | 0.442 |
0.224
0.143 | 0.296 |
0.092
0.058 | 0.120 |
0.000
0.000 | 0.000 |
|
| 1 spectrum, DIIFELR |
0.000 |
|
0.148 |
|
0.305 |
0.237 |
0.224 |
0.087 |
0.000 |
|
| 2 spectra, SIILNHVIR |
0.000 |
|
0.291 |
|
0.000 |
0.436 |
0.105 |
0.168 |
0.000 |
|
| 1 spectrum, IQPEILELIK |
0.000 |
|
0.207 |
|
0.156 |
0.328 |
0.308 |
0.000 |
0.000 |
|
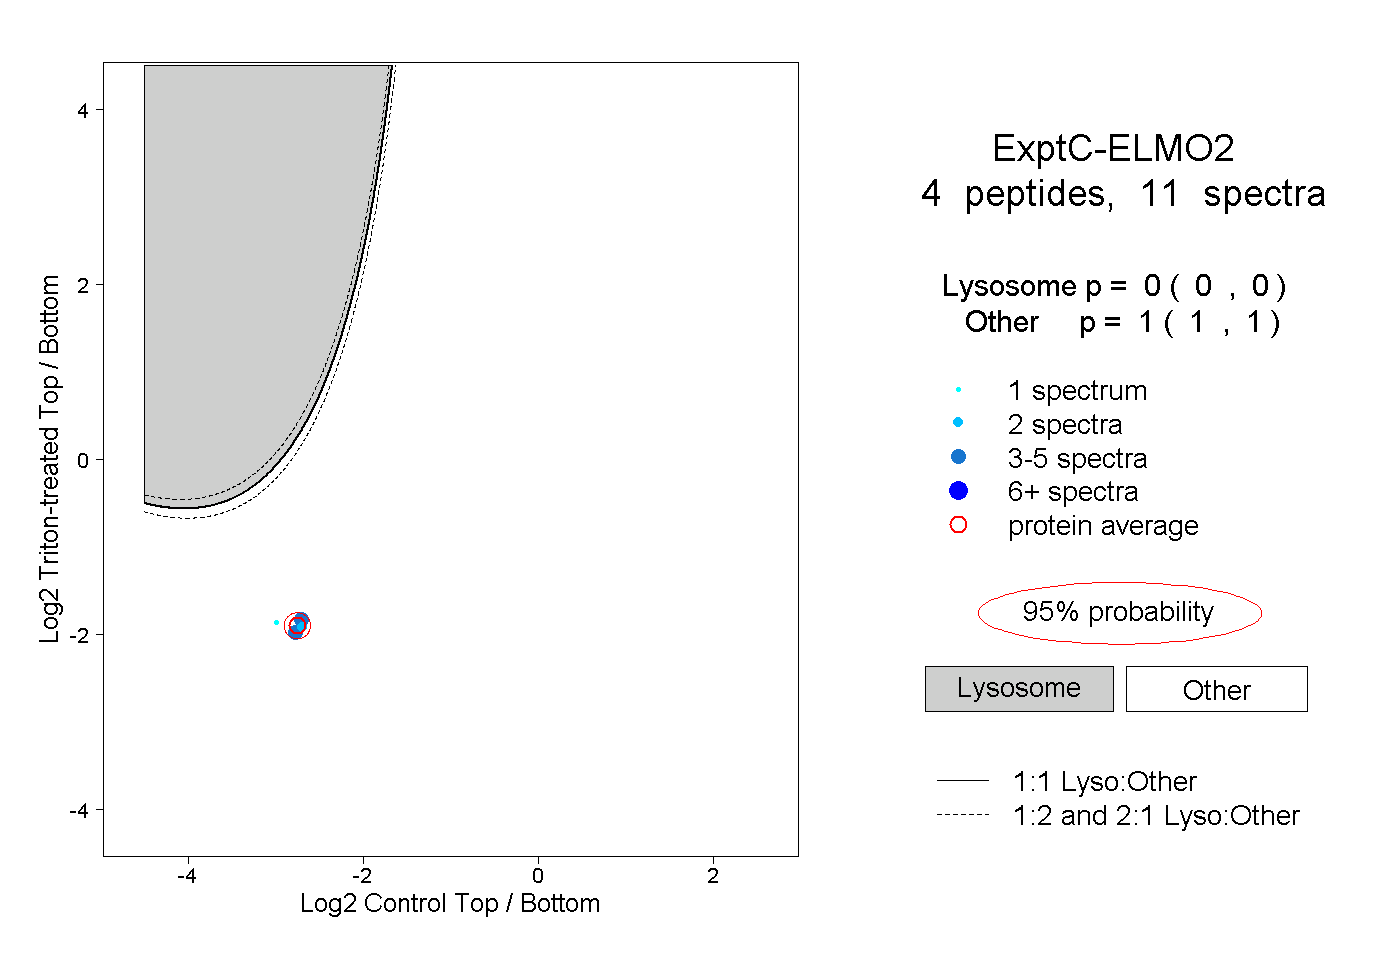
| | | Plot |
|
Lyso |
|
|
|
|
|
|
|
Other |
| Expt C |
4
peptides |
11
spectra |
 |
|
0.000
0.000 | 0.000 |
|
|
|
|
|
|
|
1.000
1.000 | 1.000 |