 6
6peptides
spectra
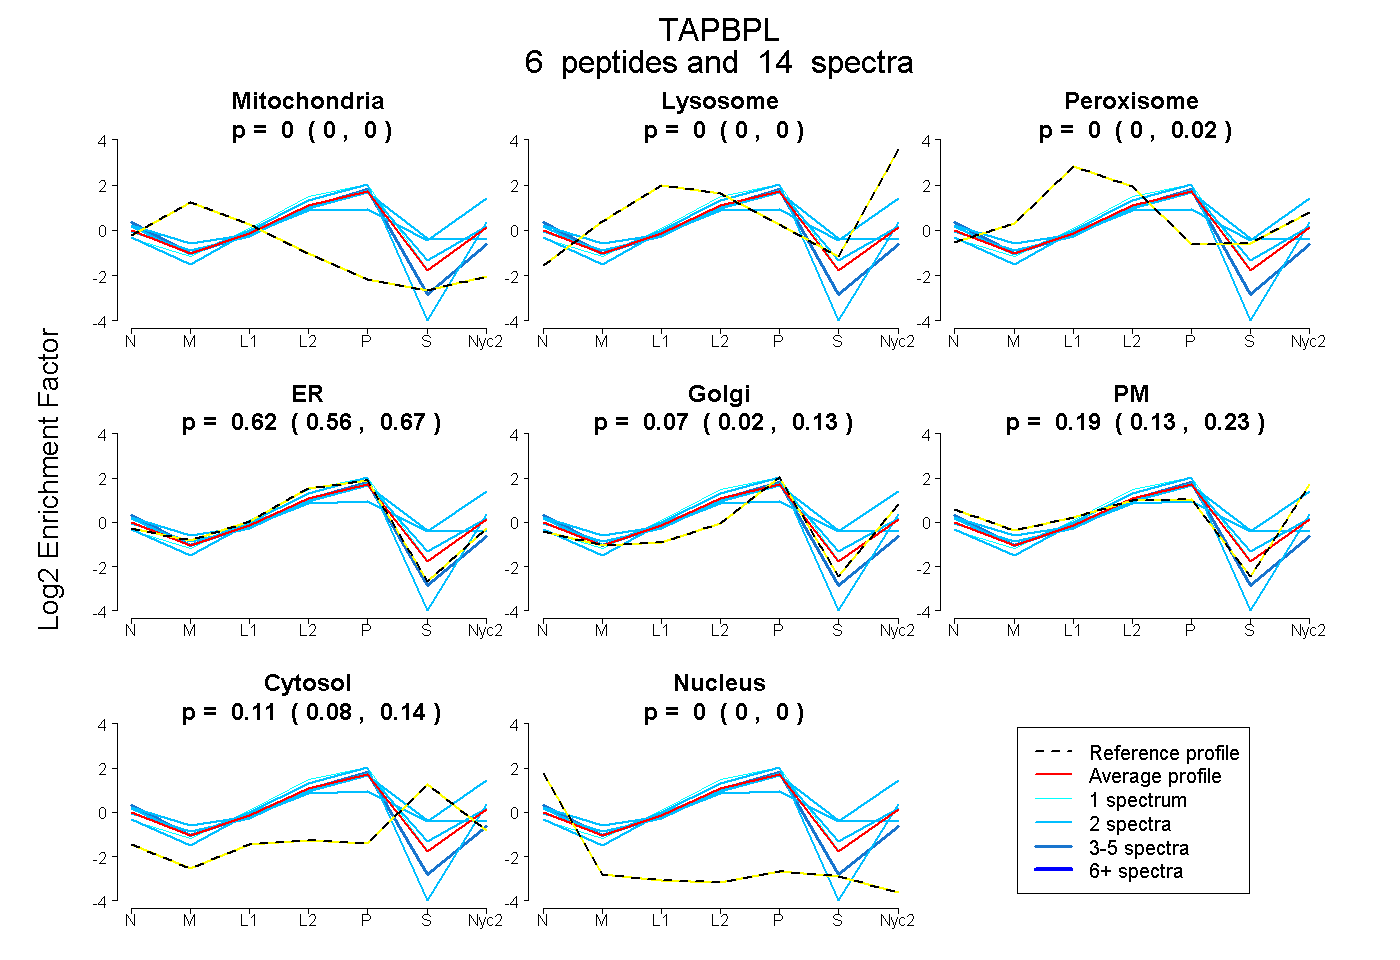
0.000 | 0.000
0.000 | 0.000
0.000 | 0.018
0.557 | 0.674
0.020 | 0.126
0.130 | 0.229
0.075 | 0.141
0.000 | 0.000
8peptides
spectra
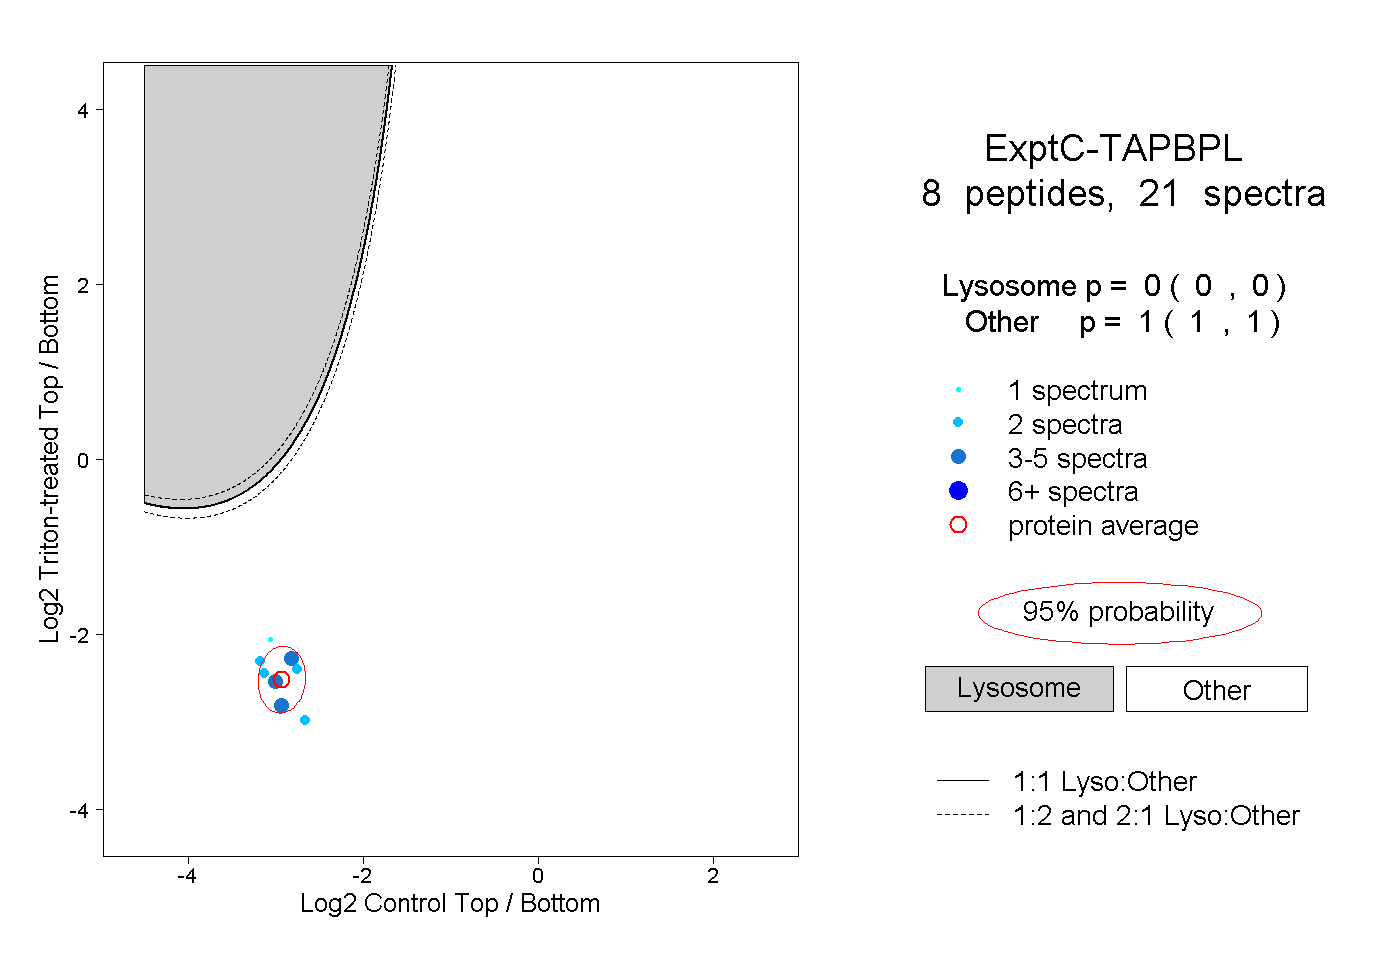
0.000 | 0.000
1.000 | 1.000
1peptide
spectra
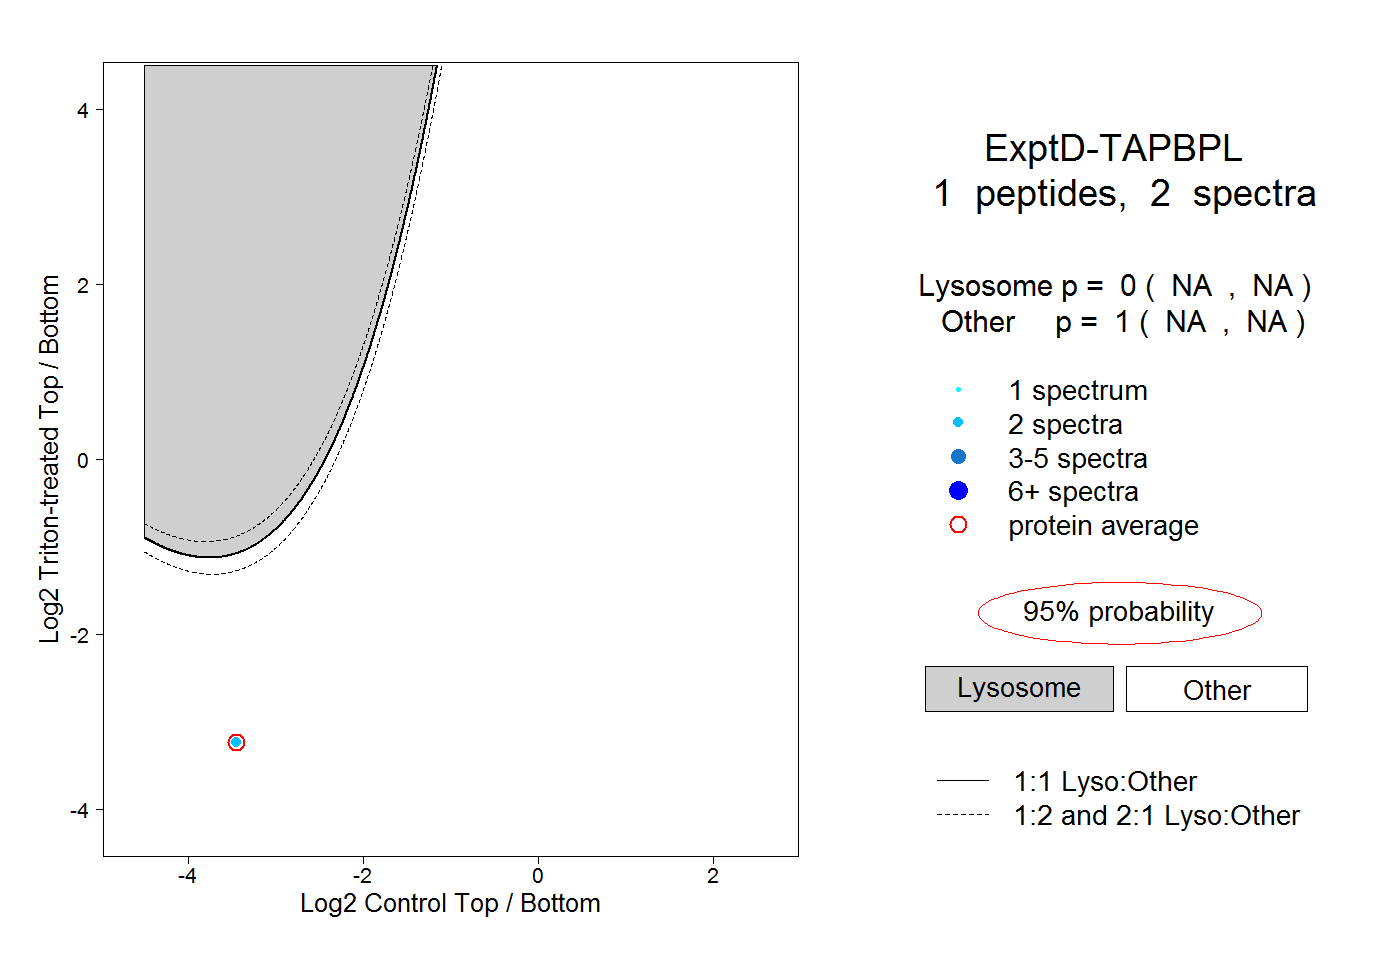
NA | NA
NA | NA