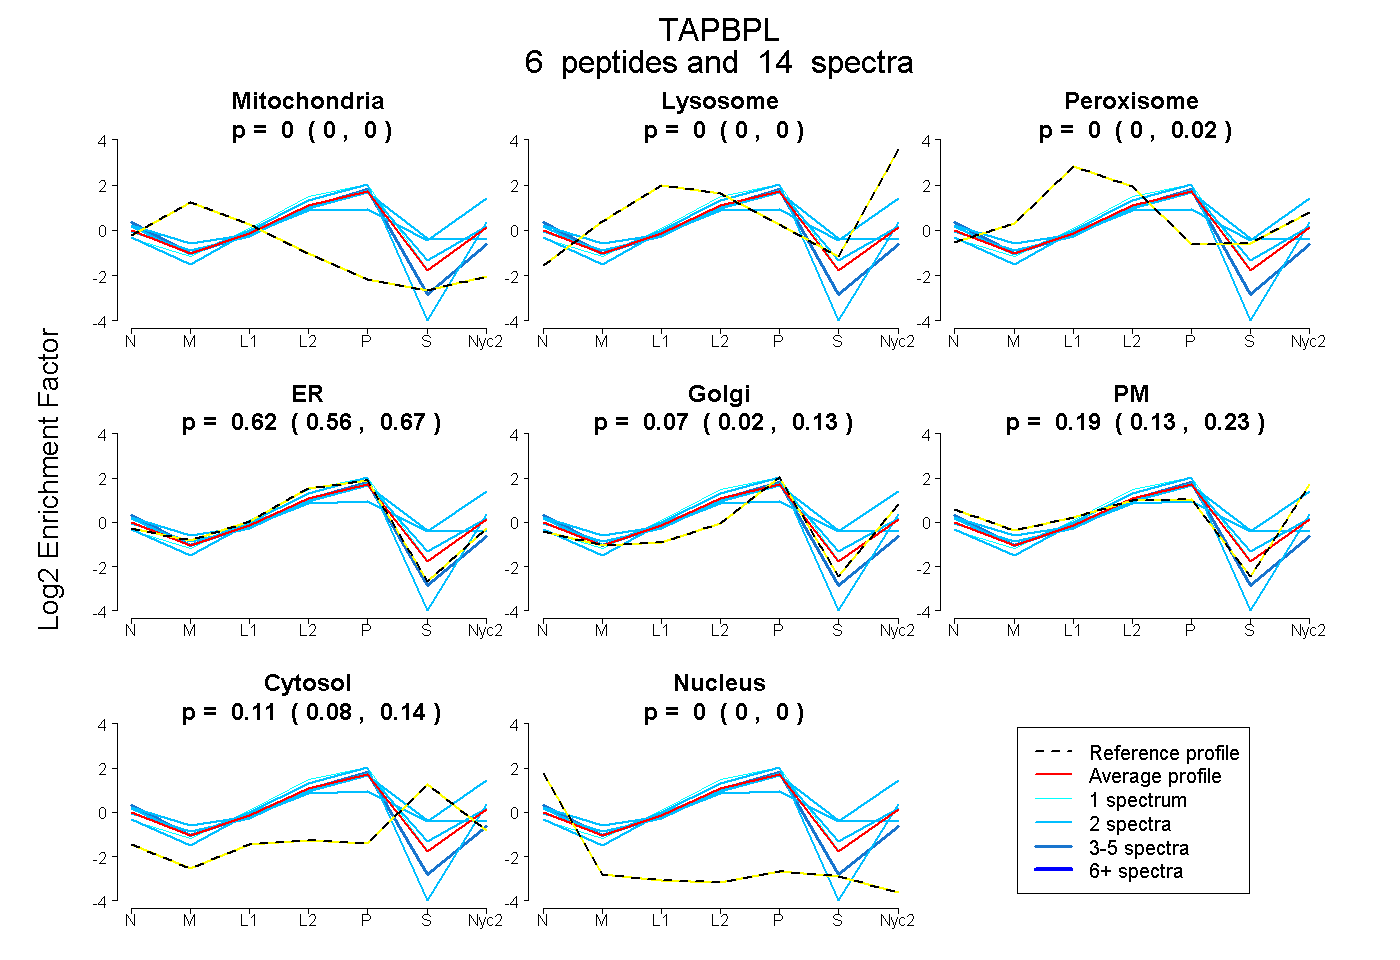
 6
6peptides
spectra
0.000 | 0.000
0.000 | 0.000
0.000 | 0.018
0.557 | 0.674
0.020 | 0.126
0.130 | 0.229
0.075 | 0.141
0.000 | 0.000
| Plot | Mito | Lyso | Perox | ER | Golgi | PM | Cytosol | Nucleus | |||||
| Expt A |
6 peptides |
14 spectra |
|
0.000 0.000 | 0.000 |
0.000 0.000 | 0.000 |
0.000 0.000 | 0.018 |
0.623 0.557 | 0.674 |
0.074 0.020 | 0.126 |
0.191 0.130 | 0.229 |
0.112 0.075 | 0.141 |
0.000 0.000 | 0.000 |
| 2 spectra, VLPNTEQR | 0.000 | 0.000 | 0.000 | 0.752 | 0.063 | 0.185 | 0.000 | 0.000 | ||
| 5 spectra, ADWFISNMQVSR | 0.000 | 0.000 | 0.000 | 0.908 | 0.001 | 0.000 | 0.000 | 0.090 | ||
| 1 spectrum, FSMAPGLDLTGVEWR | 0.000 | 0.069 | 0.000 | 0.826 | 0.022 | 0.000 | 0.083 | 0.000 | ||
| 2 spectra, GATLKPEK | 0.000 | 0.000 | 0.057 | 0.640 | 0.000 | 0.000 | 0.303 | 0.000 | ||
| 2 spectra, GAFGSSEDR | 0.000 | 0.000 | 0.041 | 0.524 | 0.183 | 0.115 | 0.137 | 0.000 | ||
| 2 spectra, QQASSSK | 0.000 | 0.131 | 0.008 | 0.000 | 0.000 | 0.614 | 0.246 | 0.000 |
| Plot | Lyso | Other | |||||||||||
| Expt C |
8 peptides |
21 spectra |
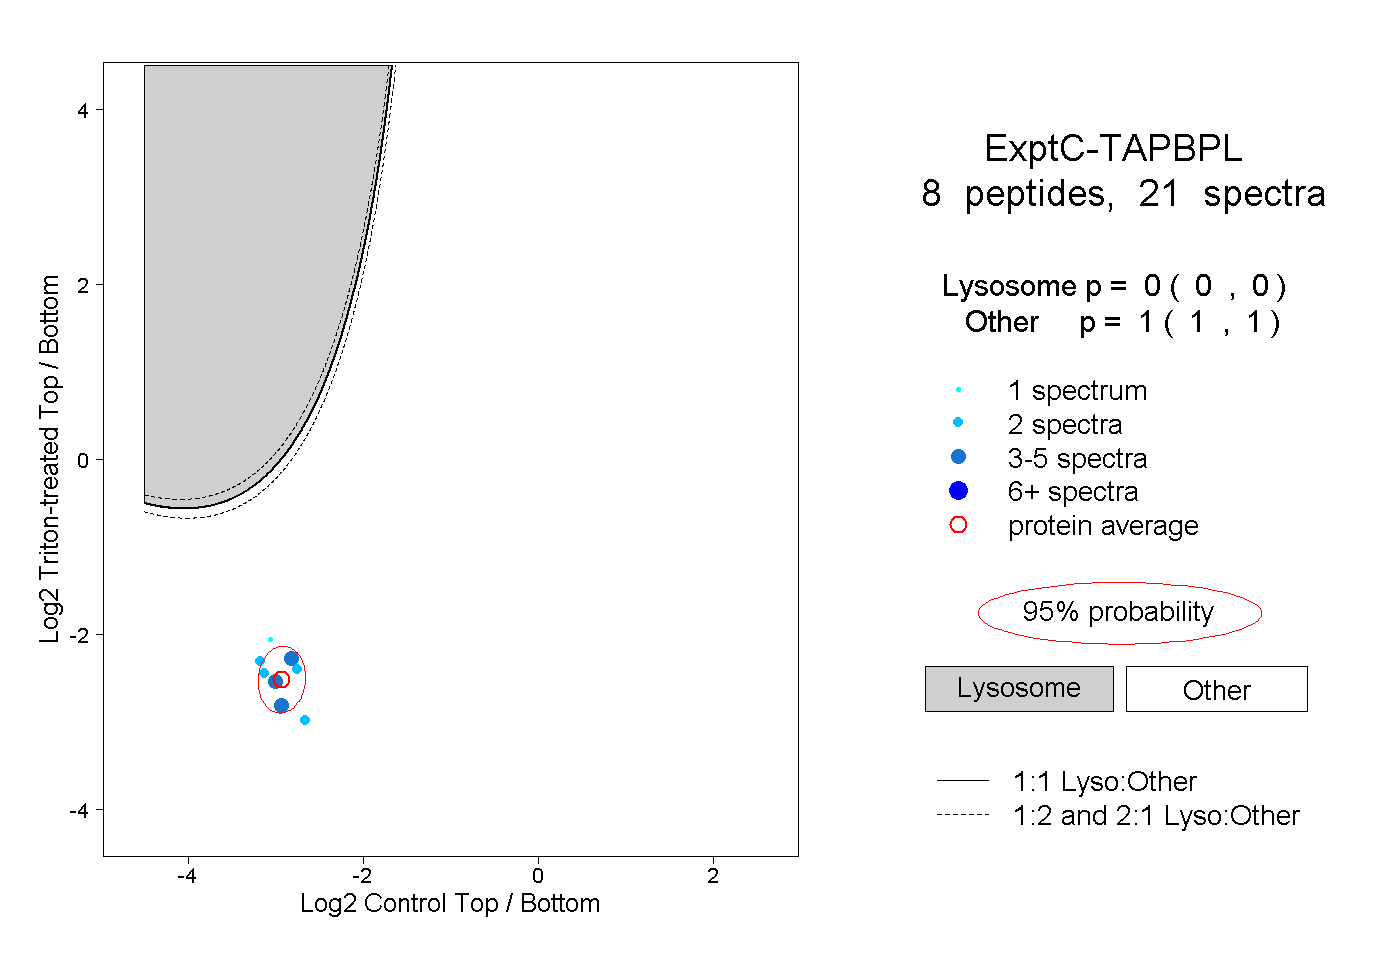 |
0.000 0.000 | 0.000 |
1.000 1.000 | 1.000 |
||||||||
| Plot | Lyso | Other | |||||||||||
| Expt D |
1 peptide |
2 spectra |
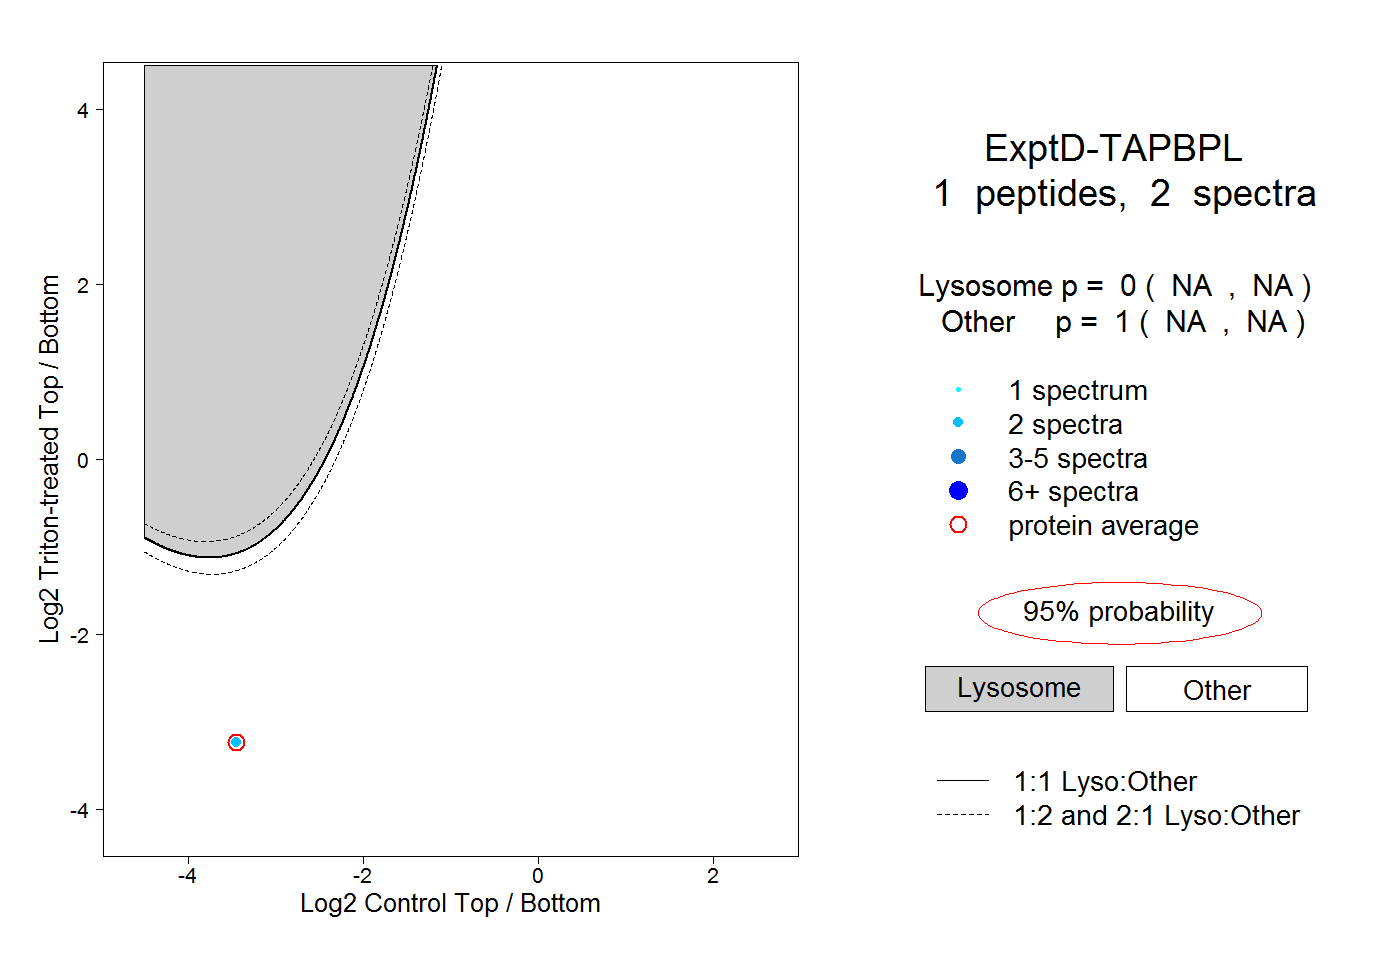 |
0.000 NA | NA |
1.000 NA | NA |