 4
4peptides
spectra
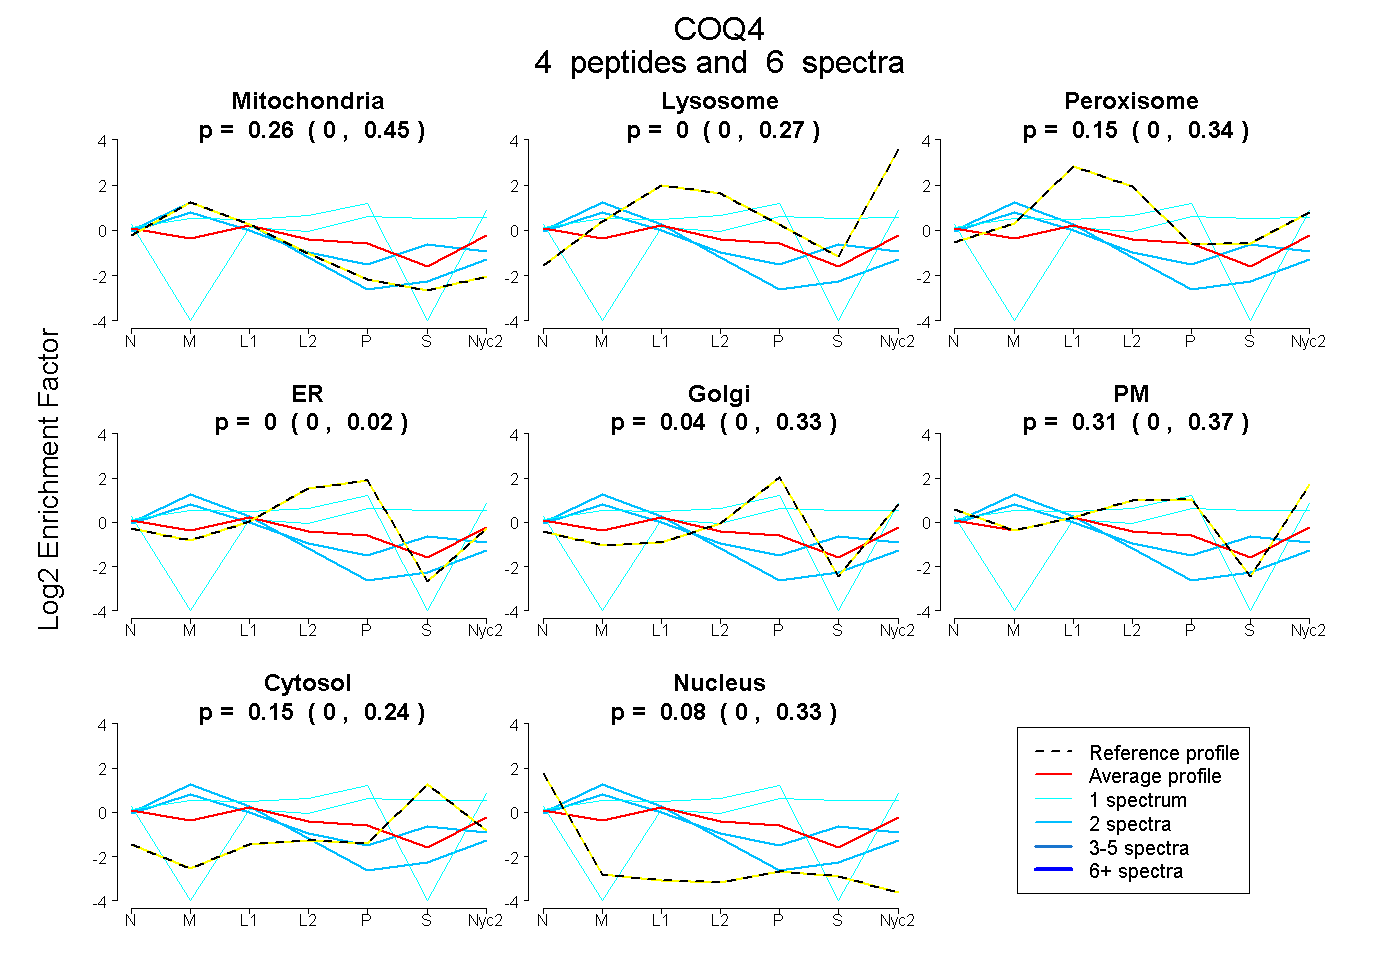
0.000 | 0.447
0.000 | 0.267
0.000 | 0.343
0.000 | 0.024
0.000 | 0.326
0.000 | 0.365
0.000 | 0.238
0.000 | 0.334
2peptides
spectra
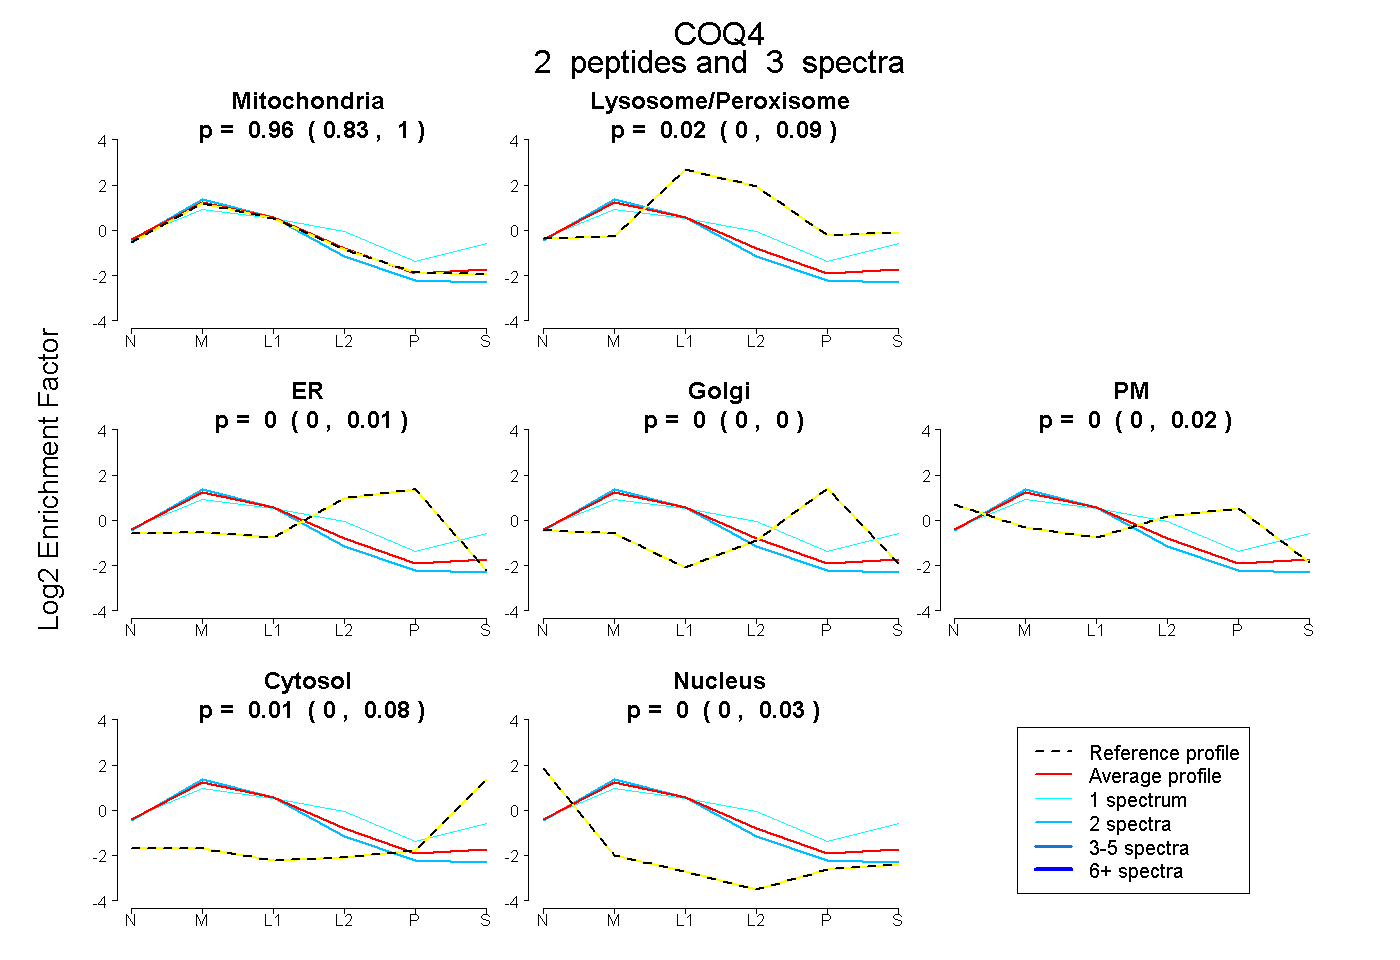
0.832 | 0.996
0.000 | 0.091
0.000 | 0.009
0.000 | 0.000
0.000 | 0.022
0.000 | 0.079
0.000 | 0.028
5peptides
spectra
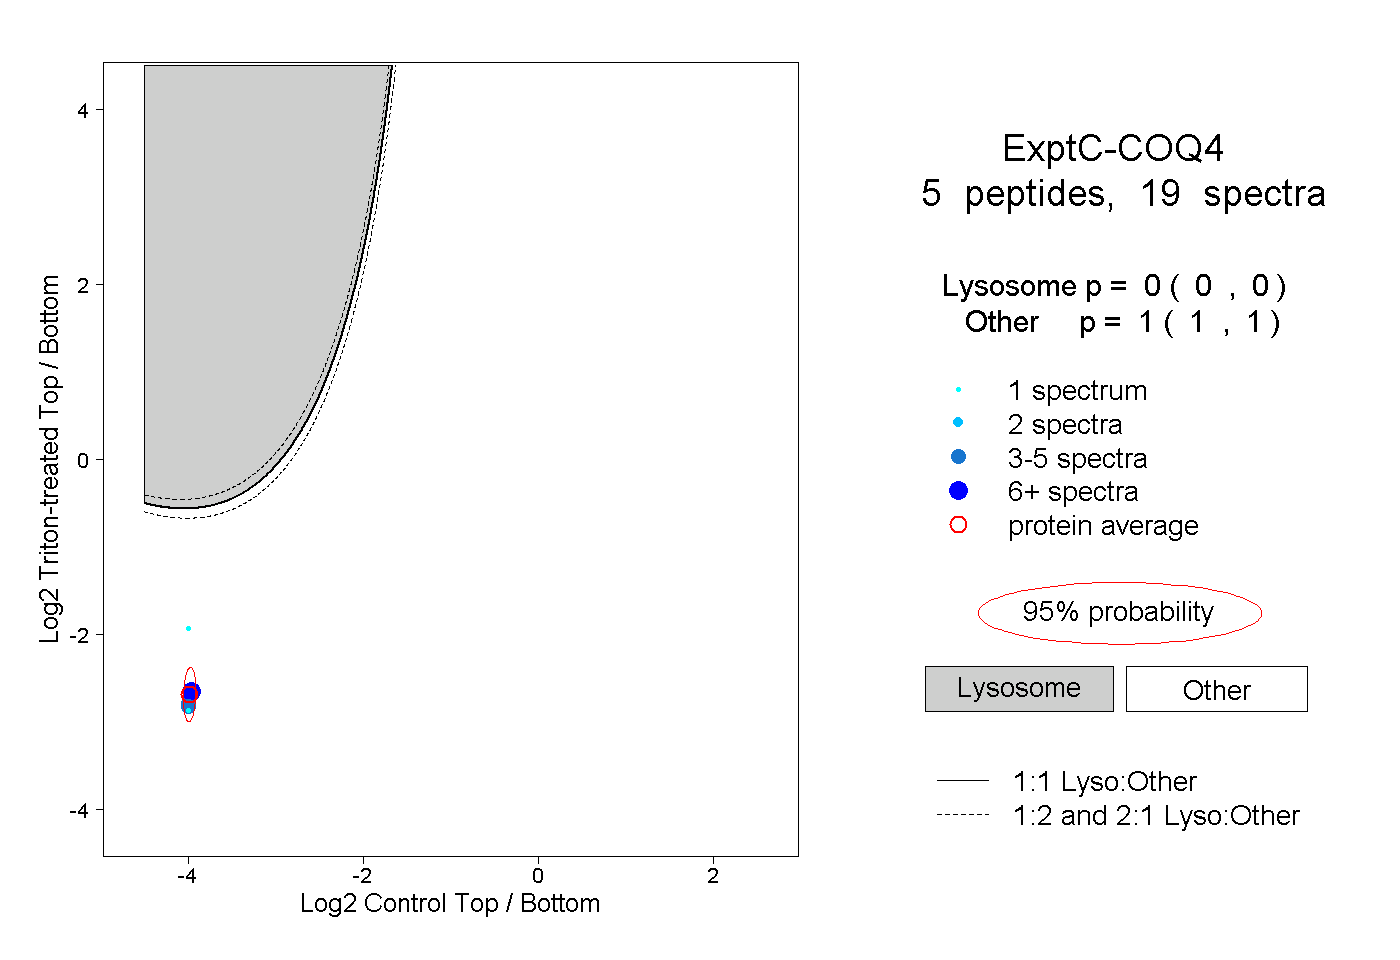
0.000 | 0.000
1.000 | 1.000