 4
4peptides
spectra
0.000 | 0.447
0.000 | 0.267
0.000 | 0.343
0.000 | 0.024
0.000 | 0.326
0.000 | 0.365
0.000 | 0.238
0.000 | 0.334
| Plot | Mito | Lyso | Perox | ER | Golgi | PM | Cytosol | Nucleus | |||||
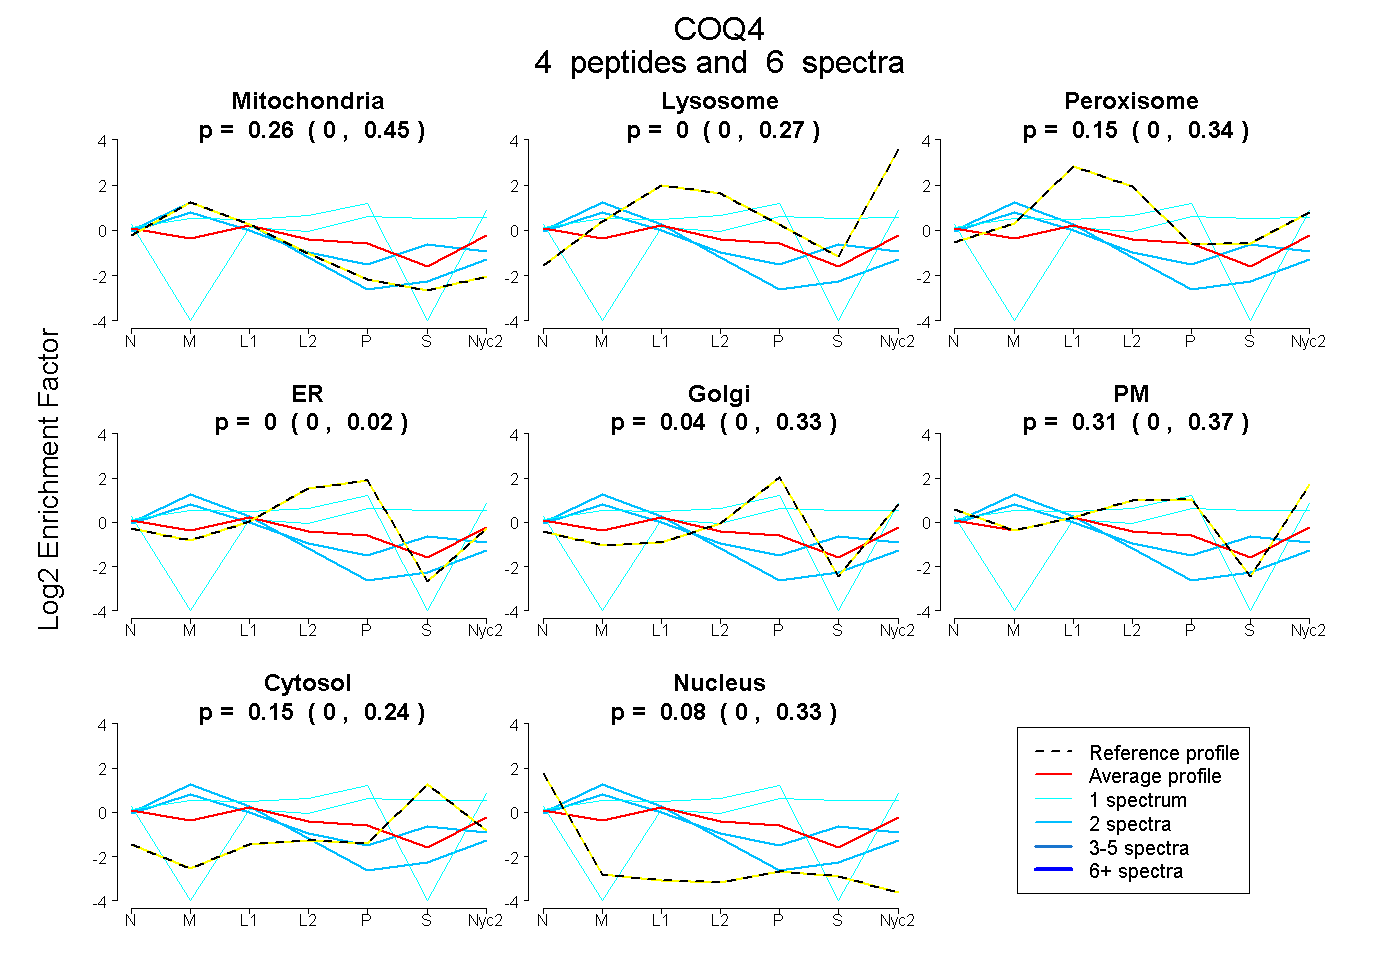
| Expt A |
4 peptides |
6 spectra |
|
0.258 0.000 | 0.447 |
0.000 0.000 | 0.267 |
0.154 0.000 | 0.343 |
0.000 0.000 | 0.024 |
0.040 0.000 | 0.326 |
0.312 0.000 | 0.365 |
0.153 0.000 | 0.238 |
0.083 0.000 | 0.334 |
| 2 spectra, LQSLPEGSLGR | 0.903 | 0.060 | 0.000 | 0.000 | 0.000 | 0.000 | 0.020 | 0.017 | ||
| 2 spectra, FVDDEELAYVIQR | 0.569 | 0.043 | 0.108 | 0.000 | 0.000 | 0.013 | 0.267 | 0.000 | ||
| 1 spectrum, APCVLNIYYEQR | 0.000 | 0.000 | 0.000 | 0.047 | 0.000 | 0.348 | 0.605 | 0.000 | ||
| 1 spectrum, MLLAAGAAGMALYNPYR | 0.147 | 0.000 | 0.000 | 0.228 | 0.000 | 0.625 | 0.000 | 0.000 |
| Plot | Mito | Lyso or Perox | ER | Golgi | PM | Cytosol | Nucleus | ||||||
| Expt B |
2 peptides |
3 spectra |
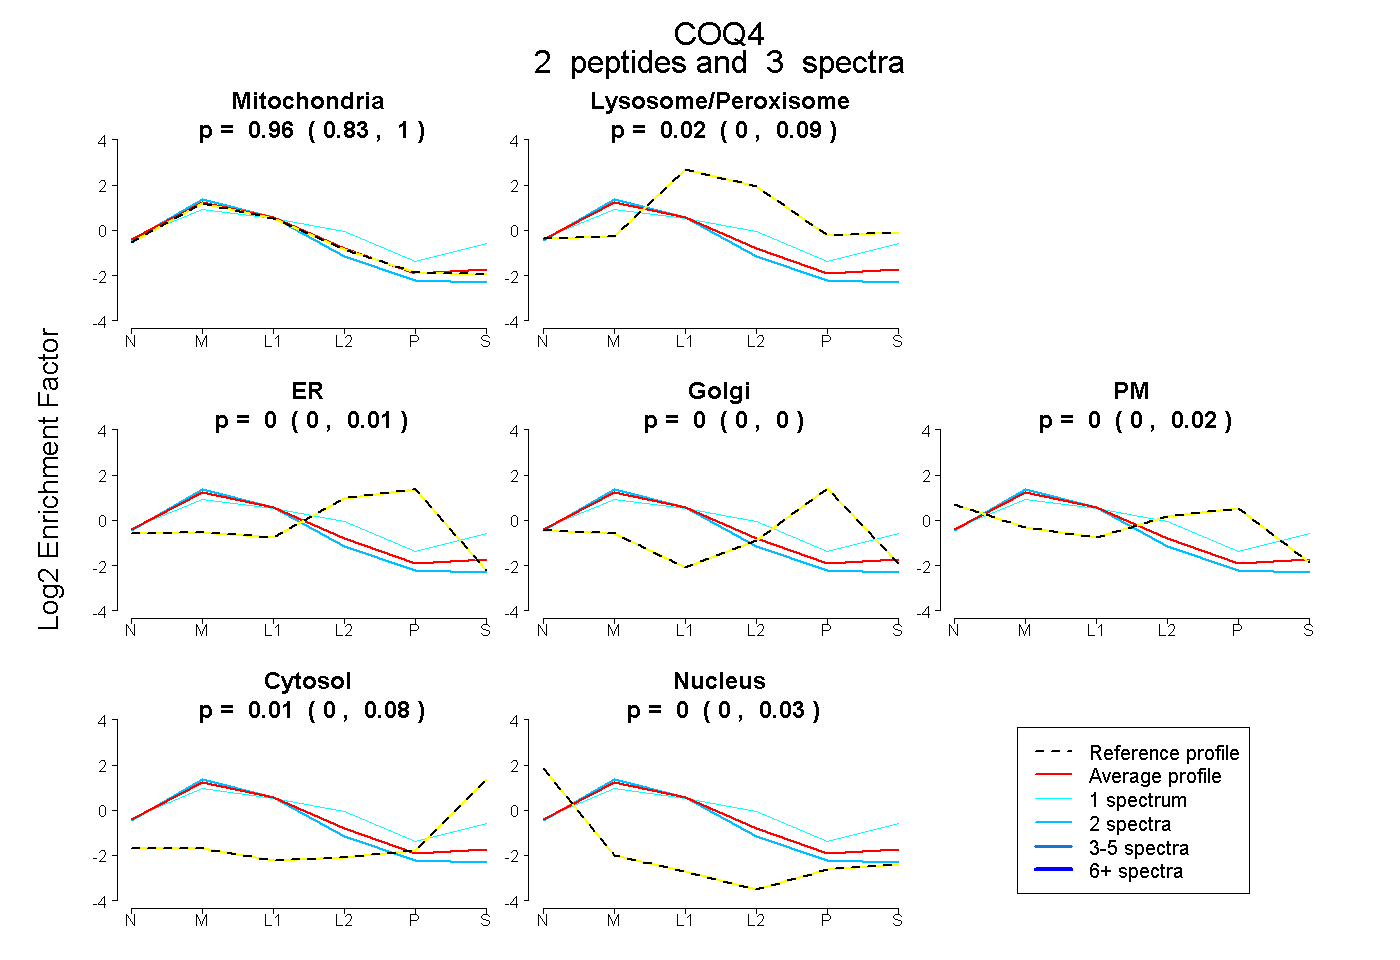 |
0.964 0.832 | 0.996 |
0.022 0.000 | 0.091 |
0.000 0.000 | 0.009 |
0.000 0.000 | 0.000 |
0.000 0.000 | 0.022 |
0.014 0.000 | 0.079 |
0.000 0.000 | 0.028 |
|||
| Plot | Lyso | Other | |||||||||||
| Expt C |
5 peptides |
19 spectra |
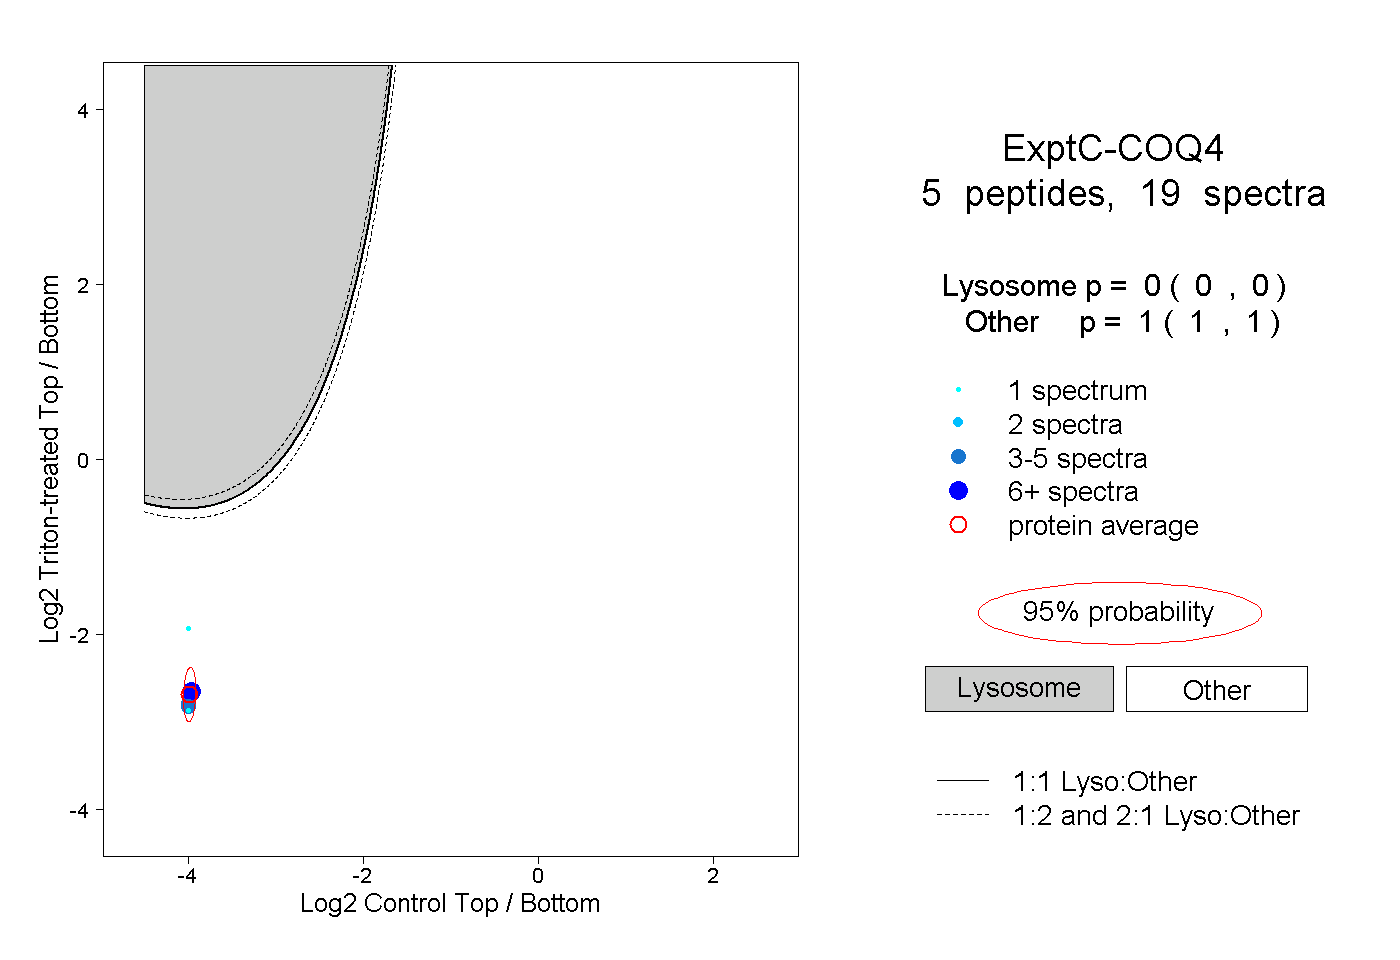 |
0.000 0.000 | 0.000 |
1.000 1.000 | 1.000 |