 13
13peptides
spectra
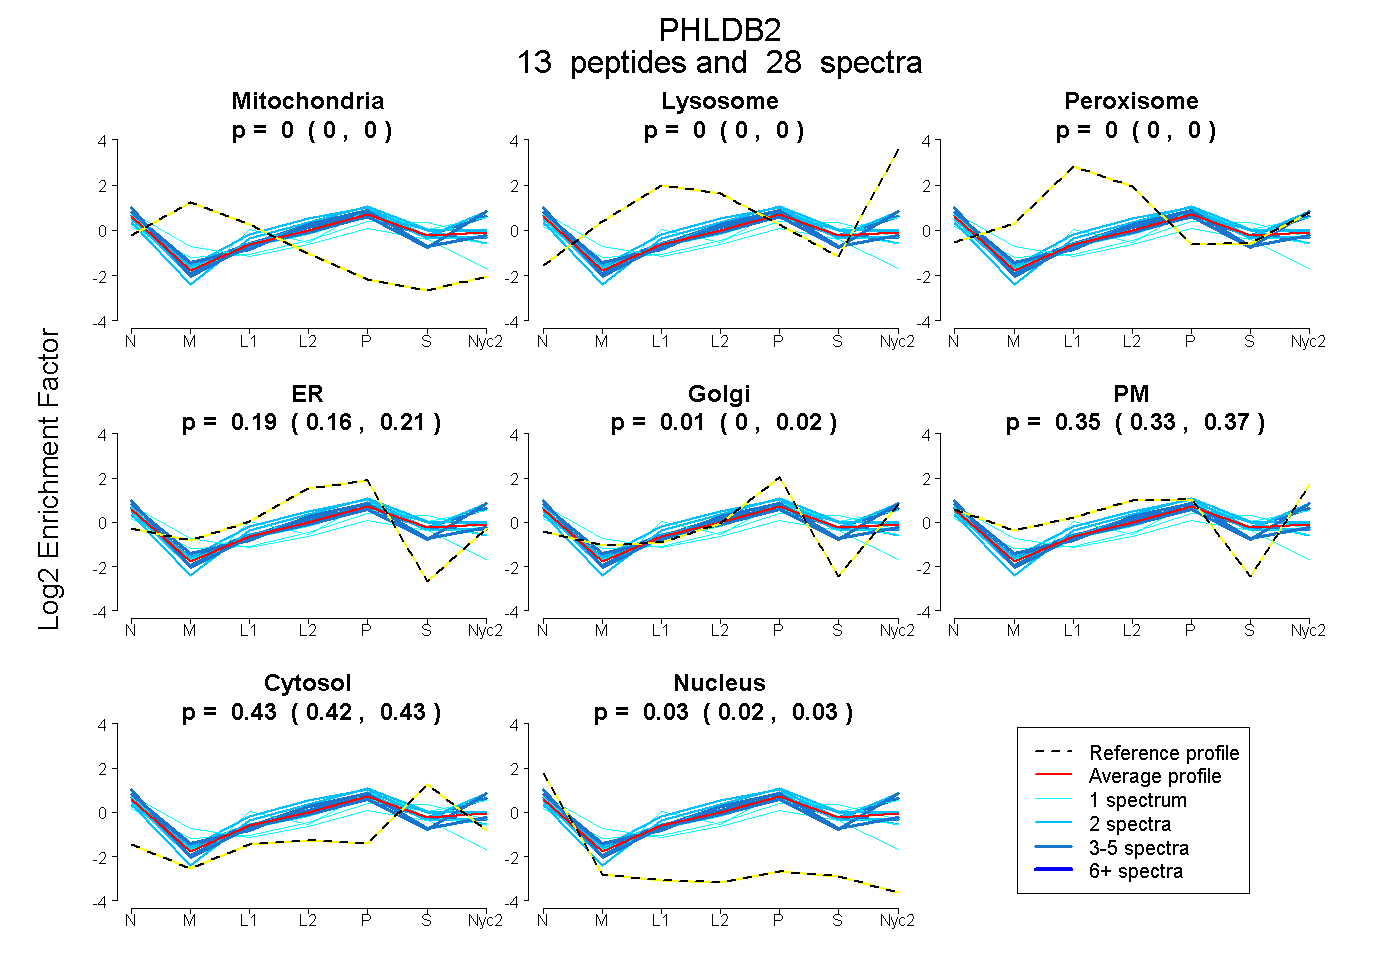
0.000 | 0.000
0.000 | 0.000
0.000 | 0.000
0.160 | 0.208
0.000 | 0.022
0.326 | 0.368
0.420 | 0.432
0.023 | 0.035
2peptides
spectra
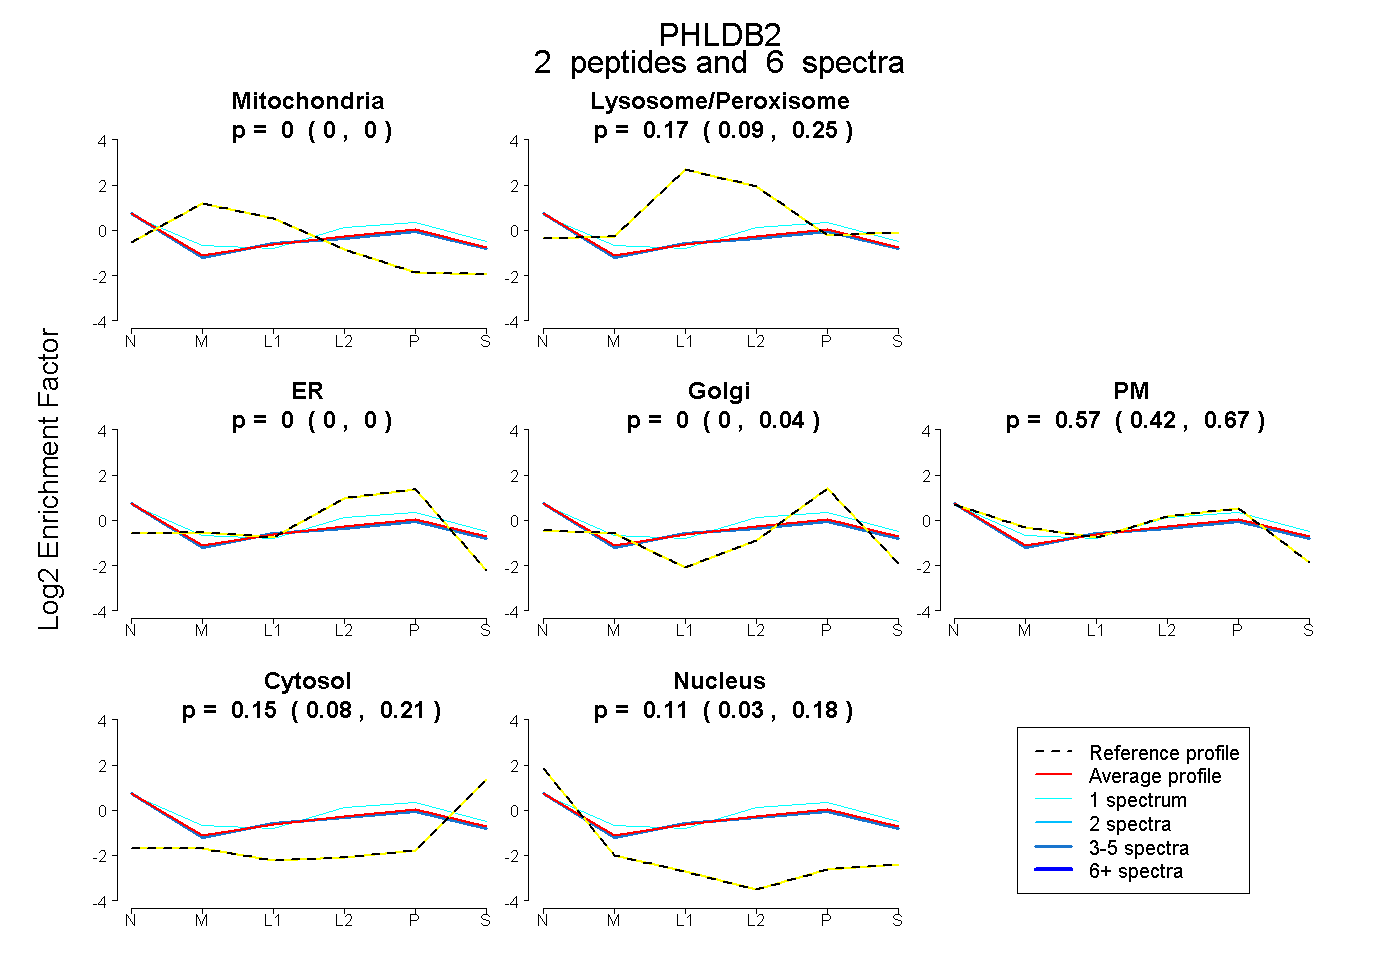
0.000 | 0.000
0.090 | 0.249
0.000 | 0.000
0.000 | 0.041
0.415 | 0.674
0.078 | 0.206
0.030 | 0.180
15peptides
spectra
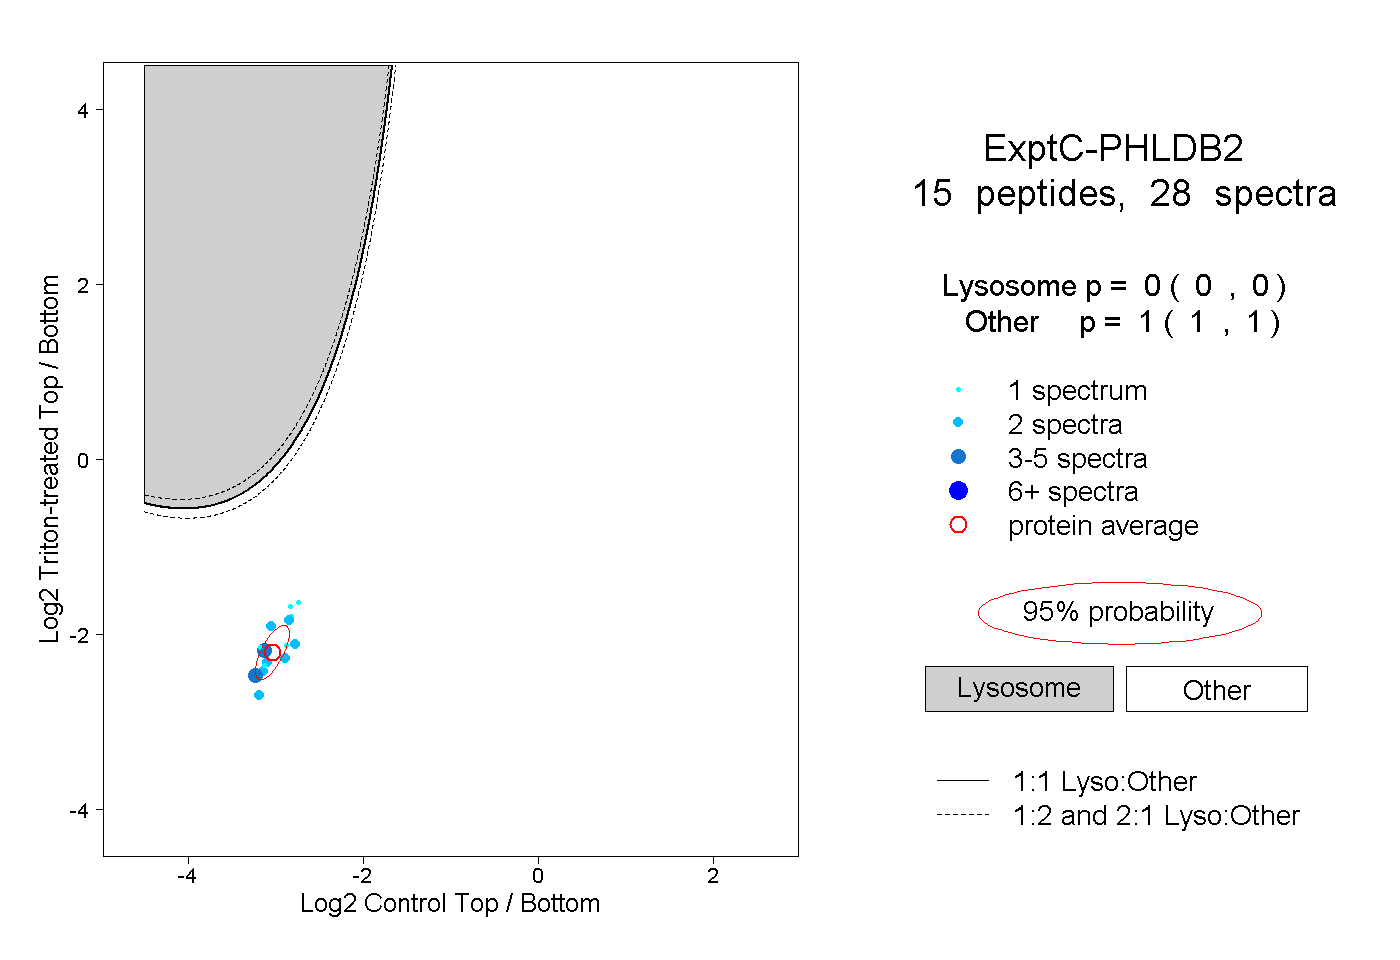
0.000 | 0.000
1.000 | 1.000
2peptides
spectra
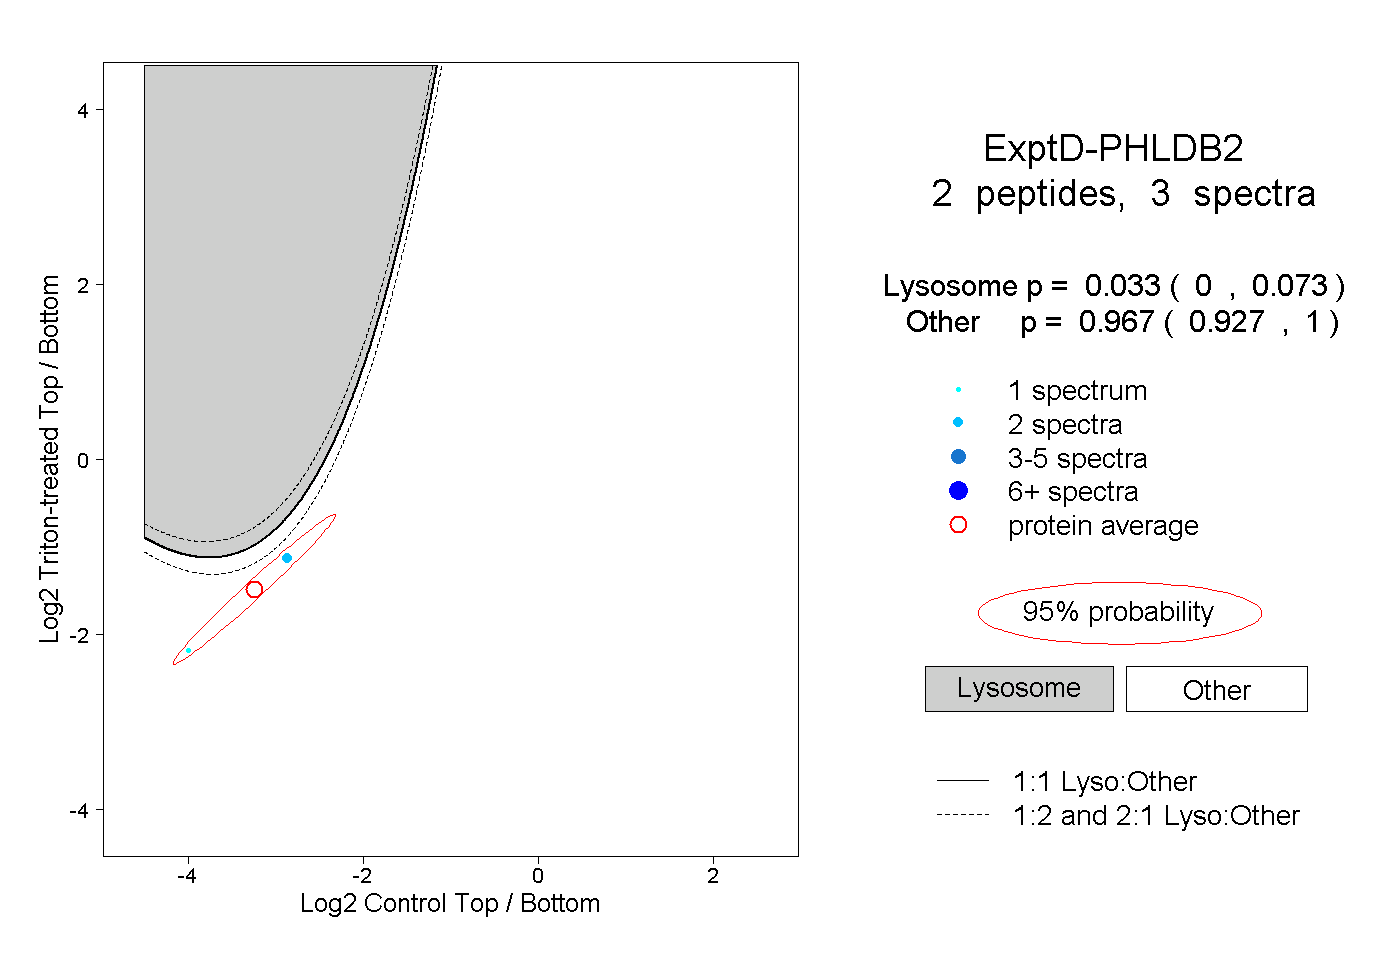
0.000 | 0.073
0.927 | 1.000