 13
13peptides
spectra
0.000 | 0.000
0.000 | 0.000
0.000 | 0.000
0.160 | 0.208
0.000 | 0.022
0.326 | 0.368
0.420 | 0.432
0.023 | 0.035
| Plot | Mito | Lyso | Perox | ER | Golgi | PM | Cytosol | Nucleus | |||||
| Expt A |
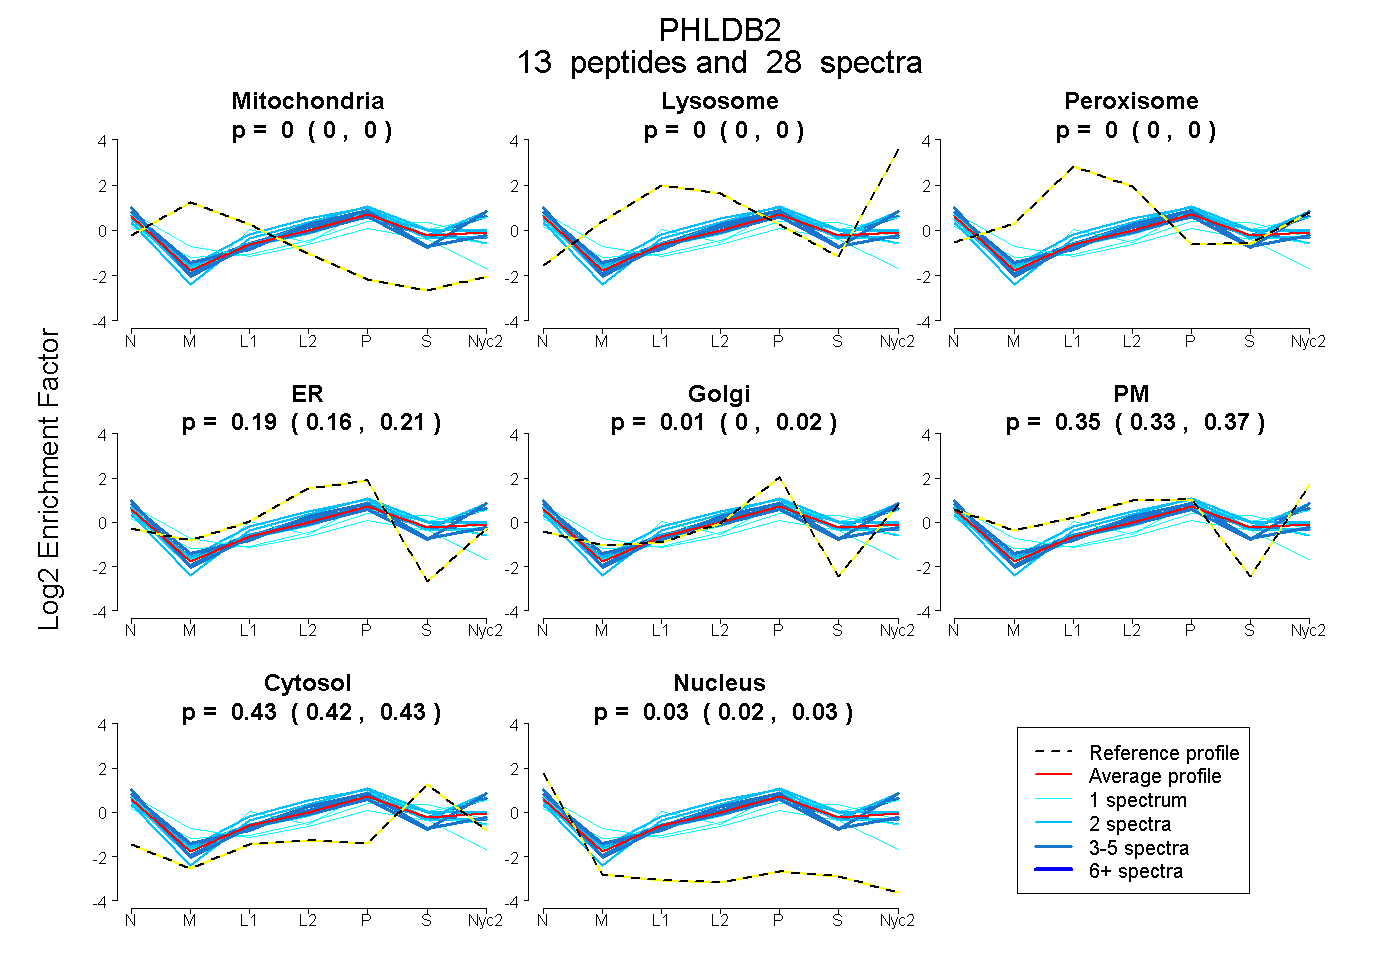
13 peptides |
28 spectra |
|
0.000 0.000 | 0.000 |
0.000 0.000 | 0.000 |
0.000 0.000 | 0.000 |
0.187 0.160 | 0.208 |
0.005 0.000 | 0.022 |
0.351 0.326 | 0.368 |
0.427 0.420 | 0.432 |
0.029 0.023 | 0.035 |
| 1 spectrum, EAHAEK | 0.000 | 0.000 | 0.000 | 0.074 | 0.101 | 0.263 | 0.548 | 0.014 | ||
| 5 spectra, VLVAR | 0.000 | 0.000 | 0.000 | 0.000 | 0.026 | 0.590 | 0.318 | 0.065 | ||
| 3 spectra, WFVFDR | 0.000 | 0.000 | 0.000 | 0.282 | 0.000 | 0.340 | 0.297 | 0.082 | ||
| 2 spectra, EQDHFVK | 0.000 | 0.000 | 0.000 | 0.314 | 0.000 | 0.264 | 0.380 | 0.041 | ||
| 3 spectra, DADLLDVESK | 0.000 | 0.000 | 0.000 | 0.000 | 0.000 | 0.569 | 0.431 | 0.000 | ||
| 1 spectrum, TQELAAMEDAR | 0.115 | 0.000 | 0.009 | 0.333 | 0.000 | 0.028 | 0.335 | 0.180 | ||
| 3 spectra, EGLYLSDTLPR | 0.000 | 0.000 | 0.000 | 0.273 | 0.000 | 0.284 | 0.401 | 0.042 | ||
| 1 spectrum, EVAEYQR | 0.000 | 0.000 | 0.000 | 0.255 | 0.000 | 0.248 | 0.415 | 0.082 | ||
| 2 spectra, QAHAEK | 0.000 | 0.000 | 0.000 | 0.171 | 0.000 | 0.331 | 0.491 | 0.007 | ||
| 2 spectra, DDLMDYHR | 0.000 | 0.000 | 0.000 | 0.379 | 0.000 | 0.140 | 0.474 | 0.007 | ||
| 1 spectrum, GYNHQQMSEGQR | 0.000 | 0.000 | 0.000 | 0.000 | 0.122 | 0.409 | 0.469 | 0.000 | ||
| 2 spectra, MLLASTSSDDFDR | 0.000 | 0.000 | 0.000 | 0.324 | 0.000 | 0.221 | 0.455 | 0.000 | ||
| 2 spectra, SPSPLGSSVR | 0.000 | 0.000 | 0.008 | 0.056 | 0.000 | 0.596 | 0.340 | 0.000 |
| Plot | Mito | Lyso or Perox | ER | Golgi | PM | Cytosol | Nucleus | ||||||
| Expt B |
2 peptides |
6 spectra |
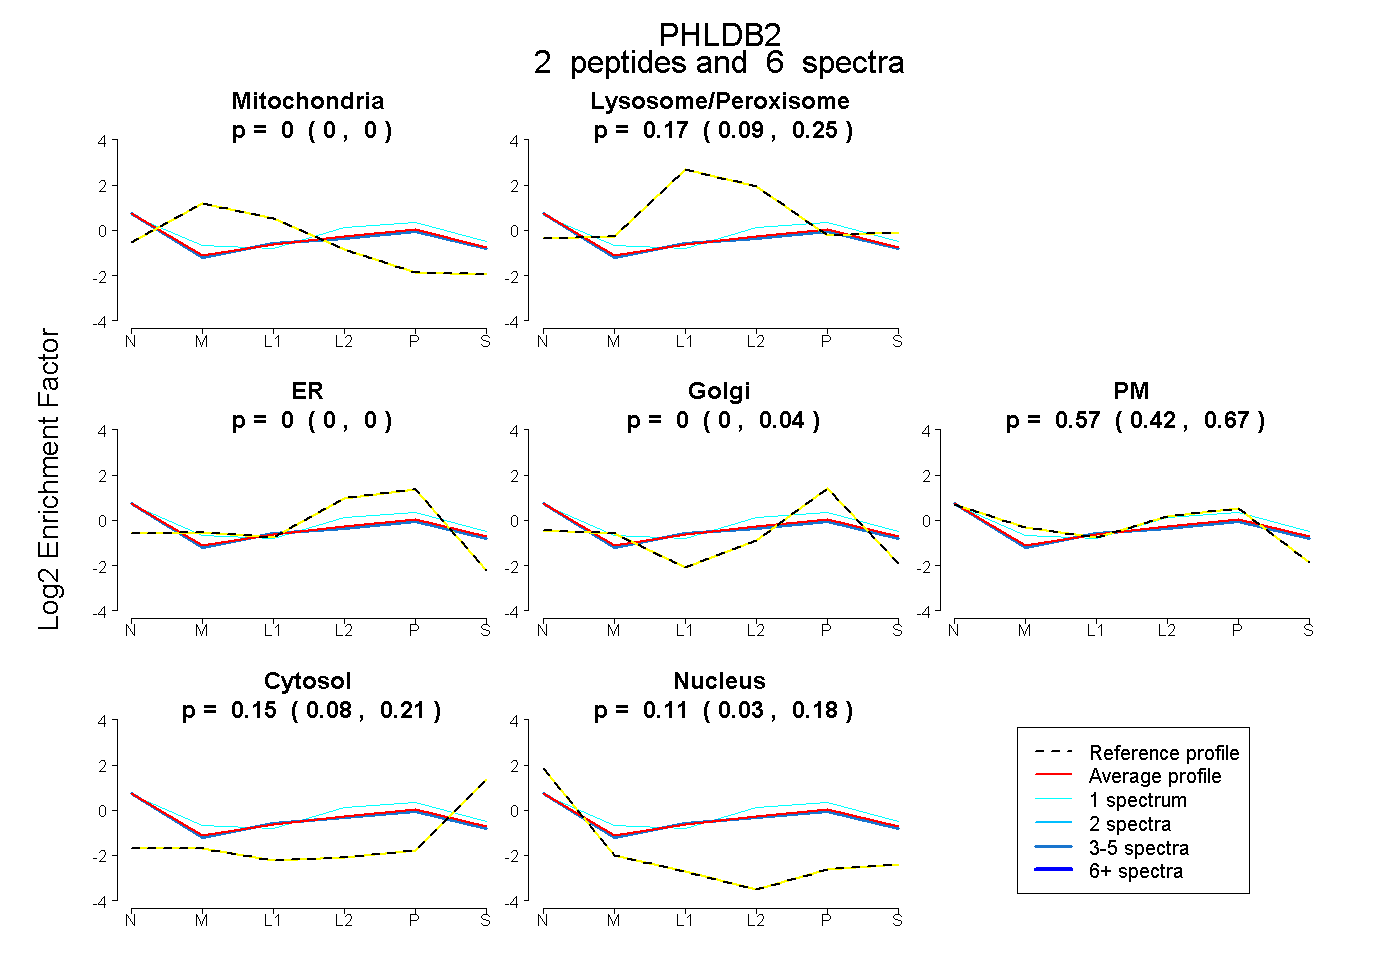 |
0.000 0.000 | 0.000 |
0.172 0.090 | 0.249 |
0.000 0.000 | 0.000 |
0.000 0.000 | 0.041 |
0.567 0.415 | 0.674 |
0.152 0.078 | 0.206 |
0.109 0.030 | 0.180 |
|||
| Plot | Lyso | Other | |||||||||||
| Expt C |
15 peptides |
28 spectra |
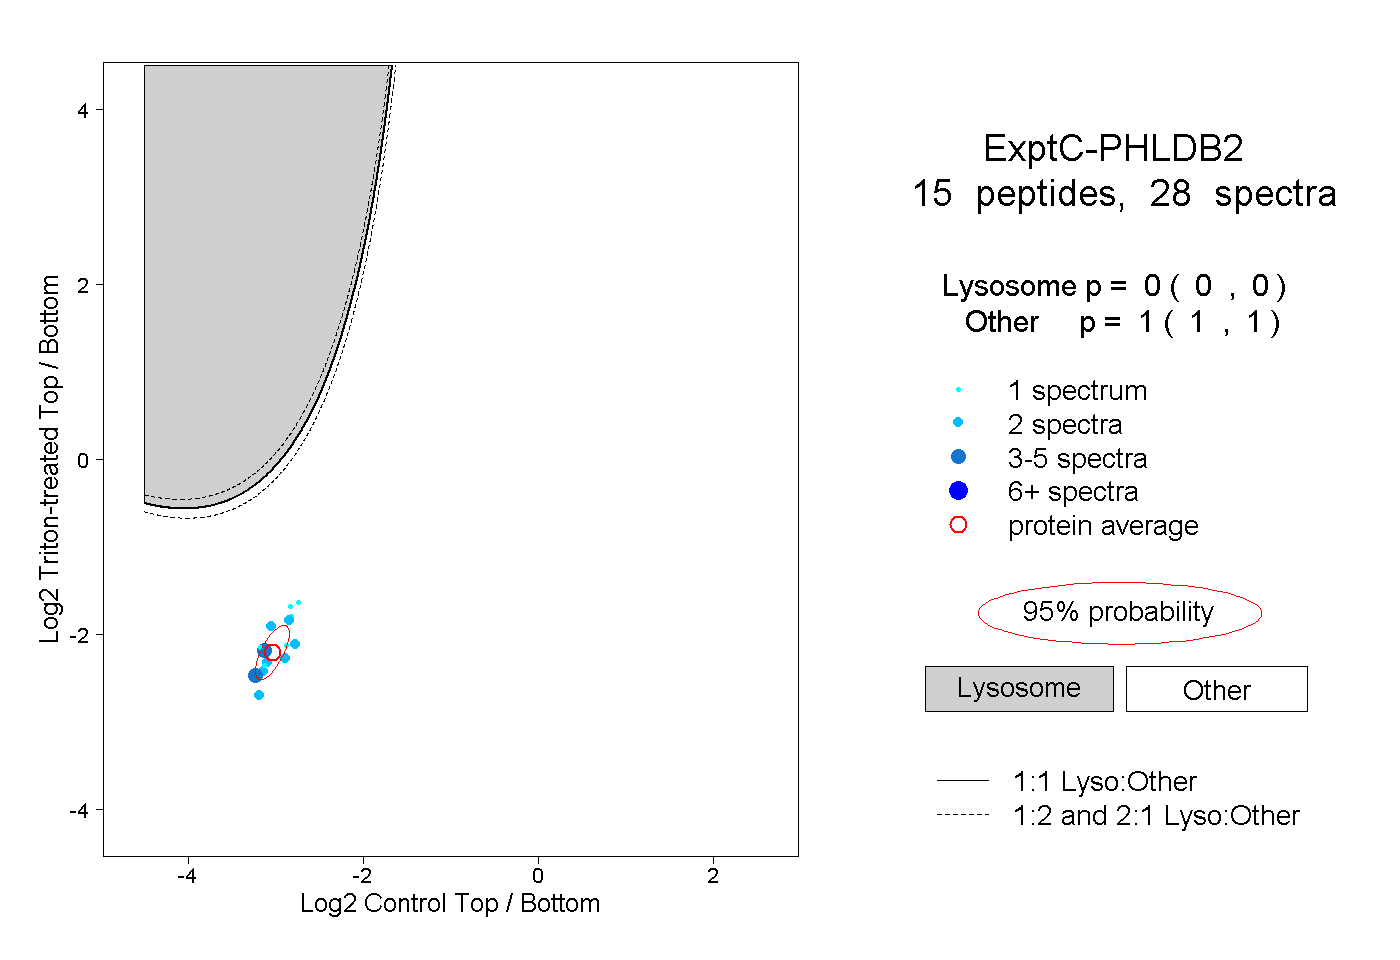 |
0.000 0.000 | 0.000 |
1.000 1.000 | 1.000 |
||||||||
| Plot | Lyso | Other | |||||||||||
| Expt D |
2 peptides |
3 spectra |
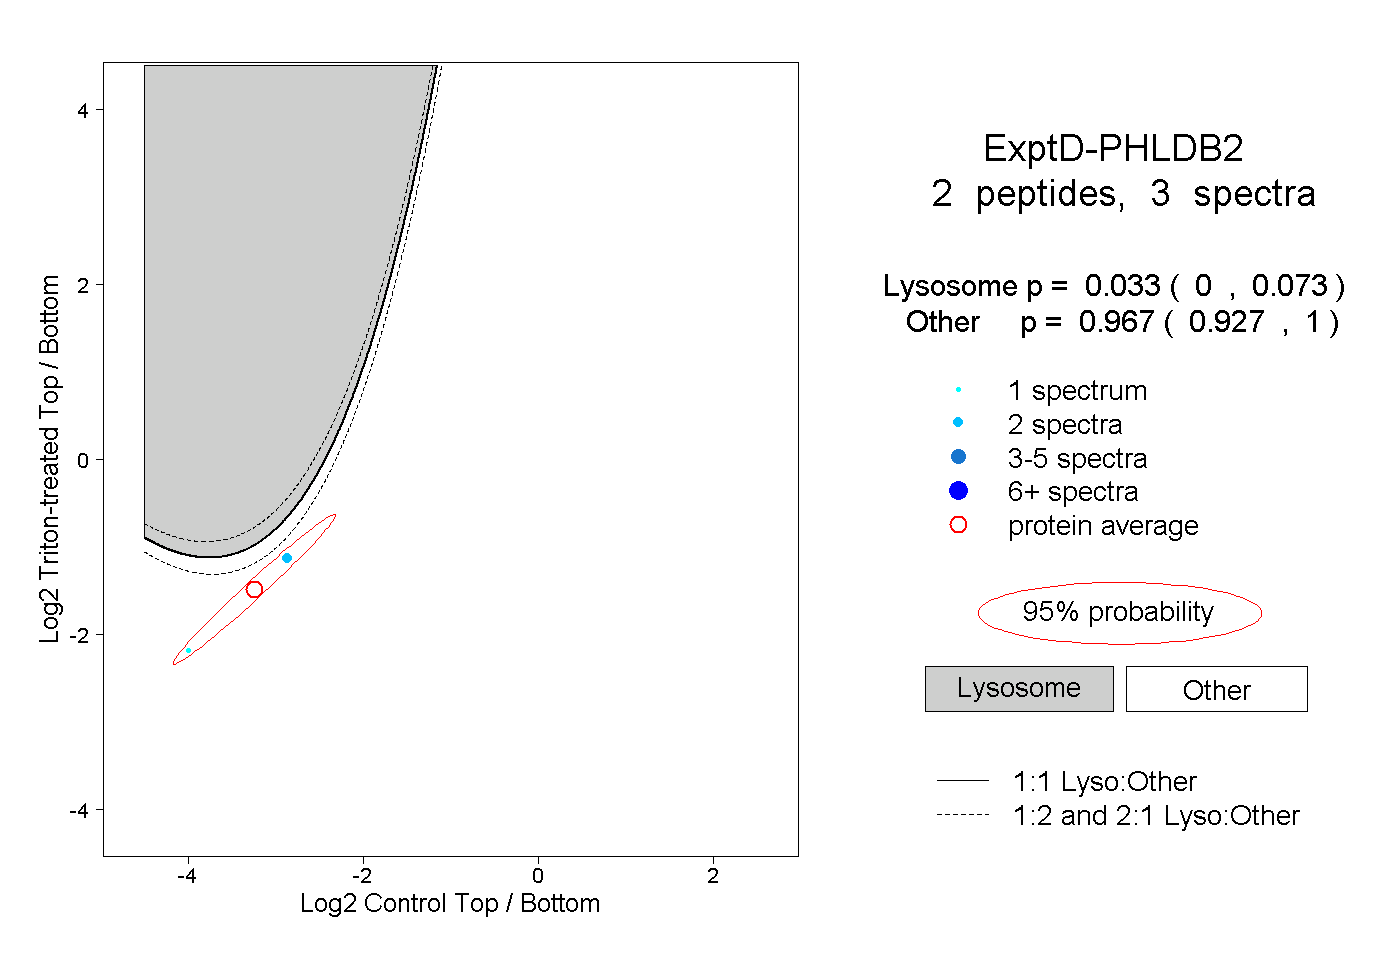 |
0.033 0.000 | 0.073 |
0.967 0.927 | 1.000 |