 15
15peptides
spectra
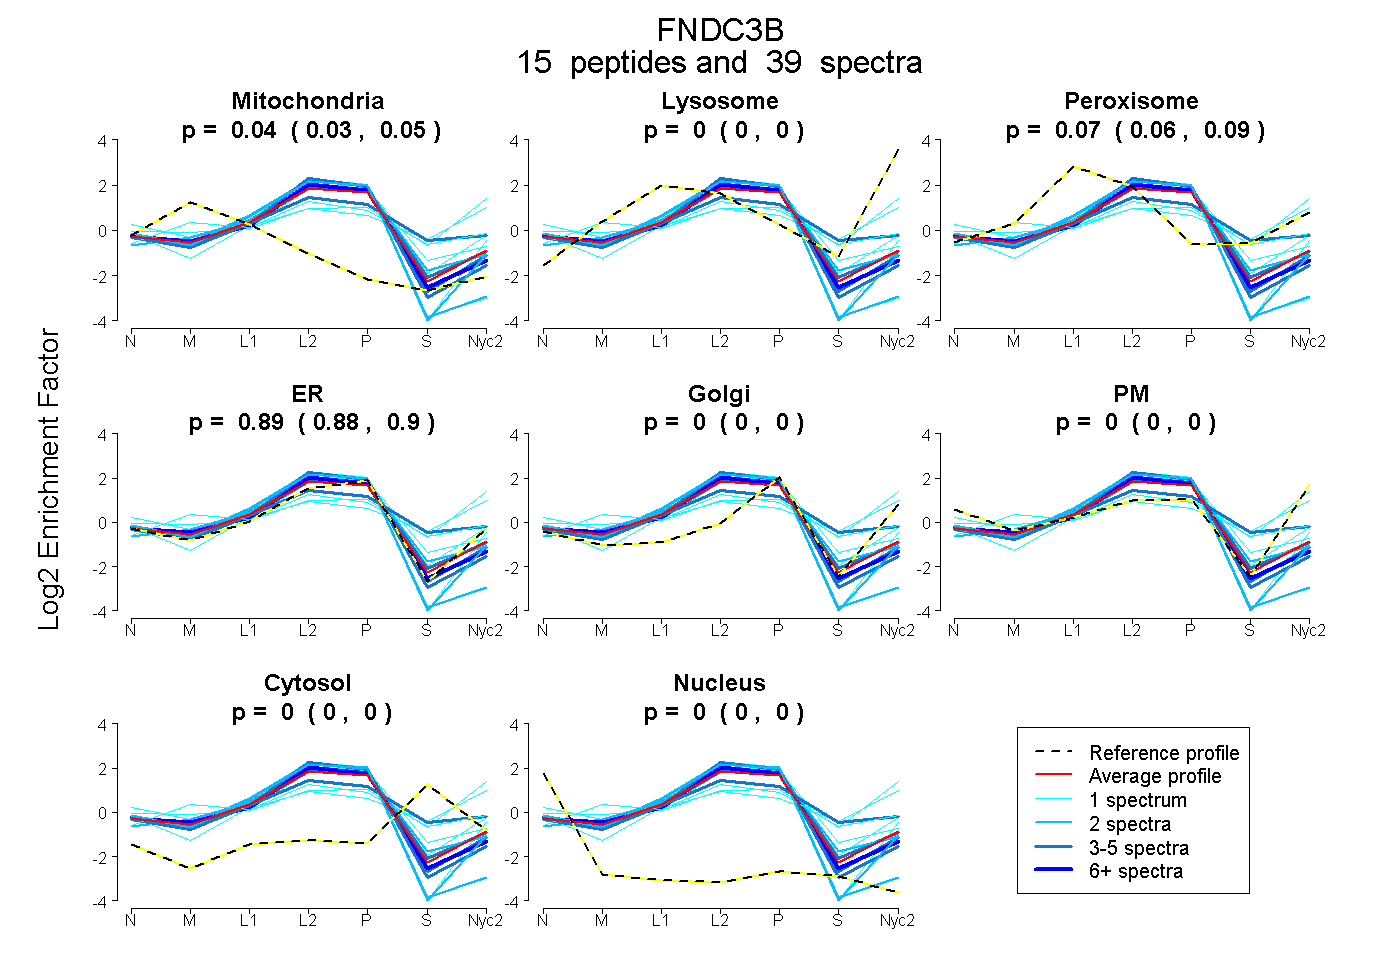
0.028 | 0.047
0.000 | 0.000
0.059 | 0.087
0.877 | 0.896
0.000 | 0.000
0.000 | 0.000
0.000 | 0.000
0.000 | 0.000
2peptides
spectra
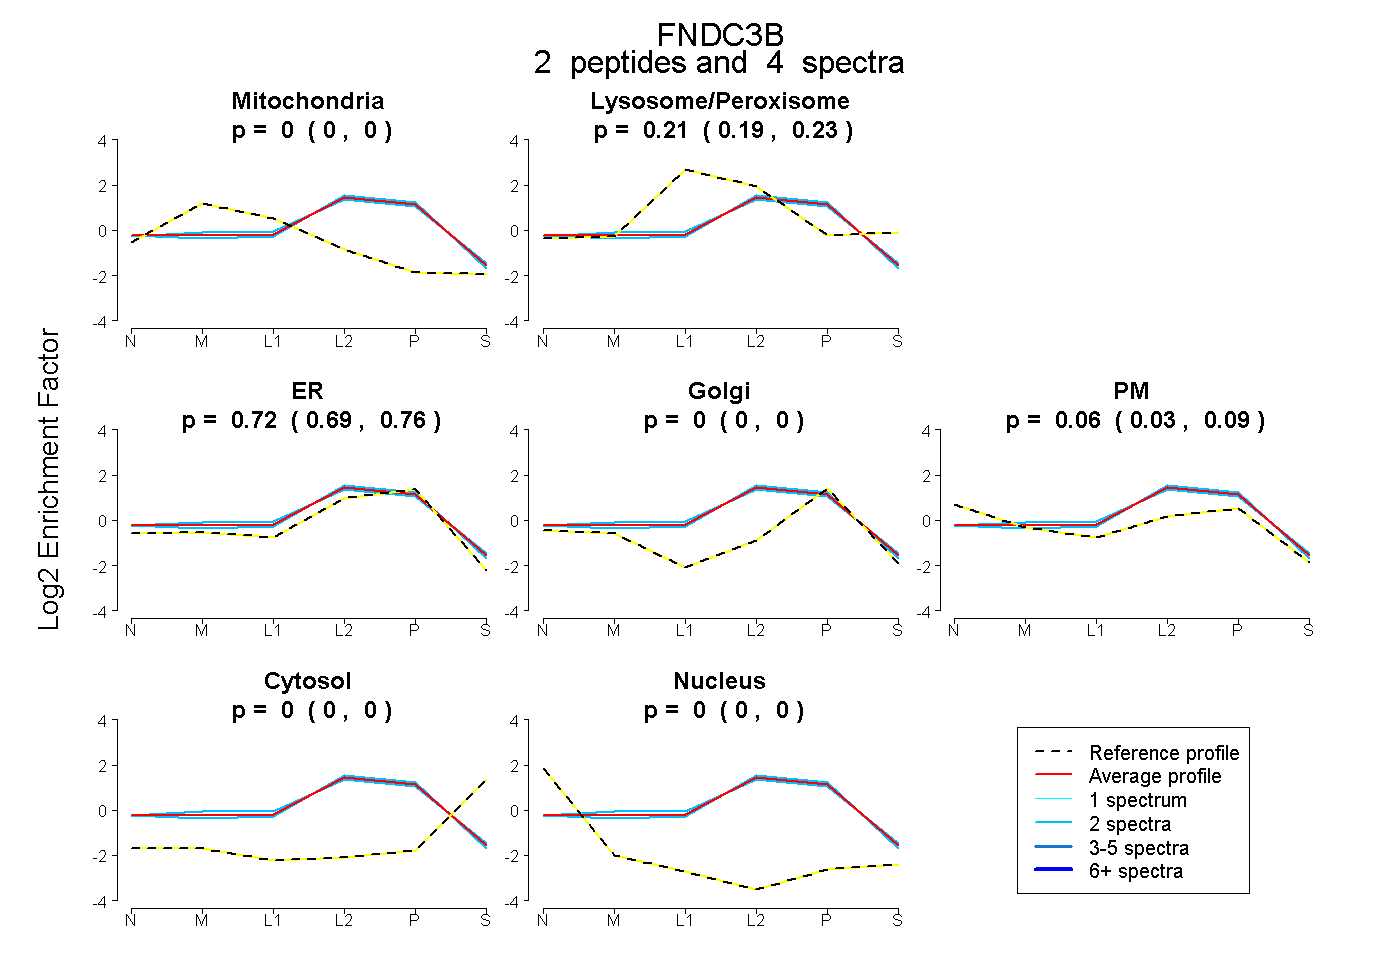
0.000 | 0.000
0.195 | 0.230
0.688 | 0.757
0.000 | 0.000
0.026 | 0.094
0.000 | 0.000
0.000 | 0.000
19peptides
spectra
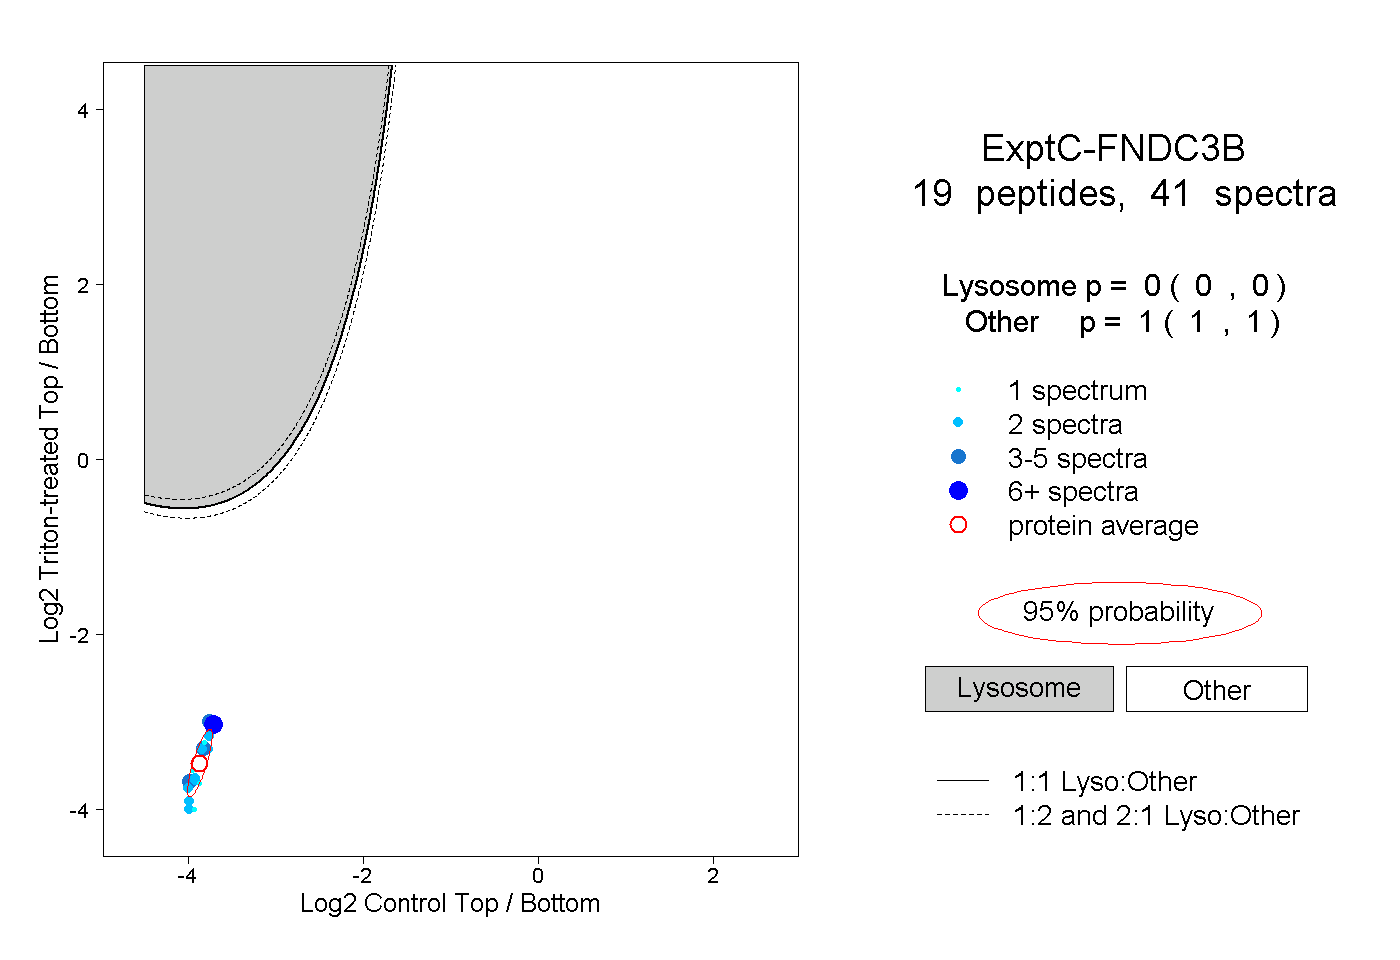
0.000 | 0.000
1.000 | 1.000
3peptides
spectra
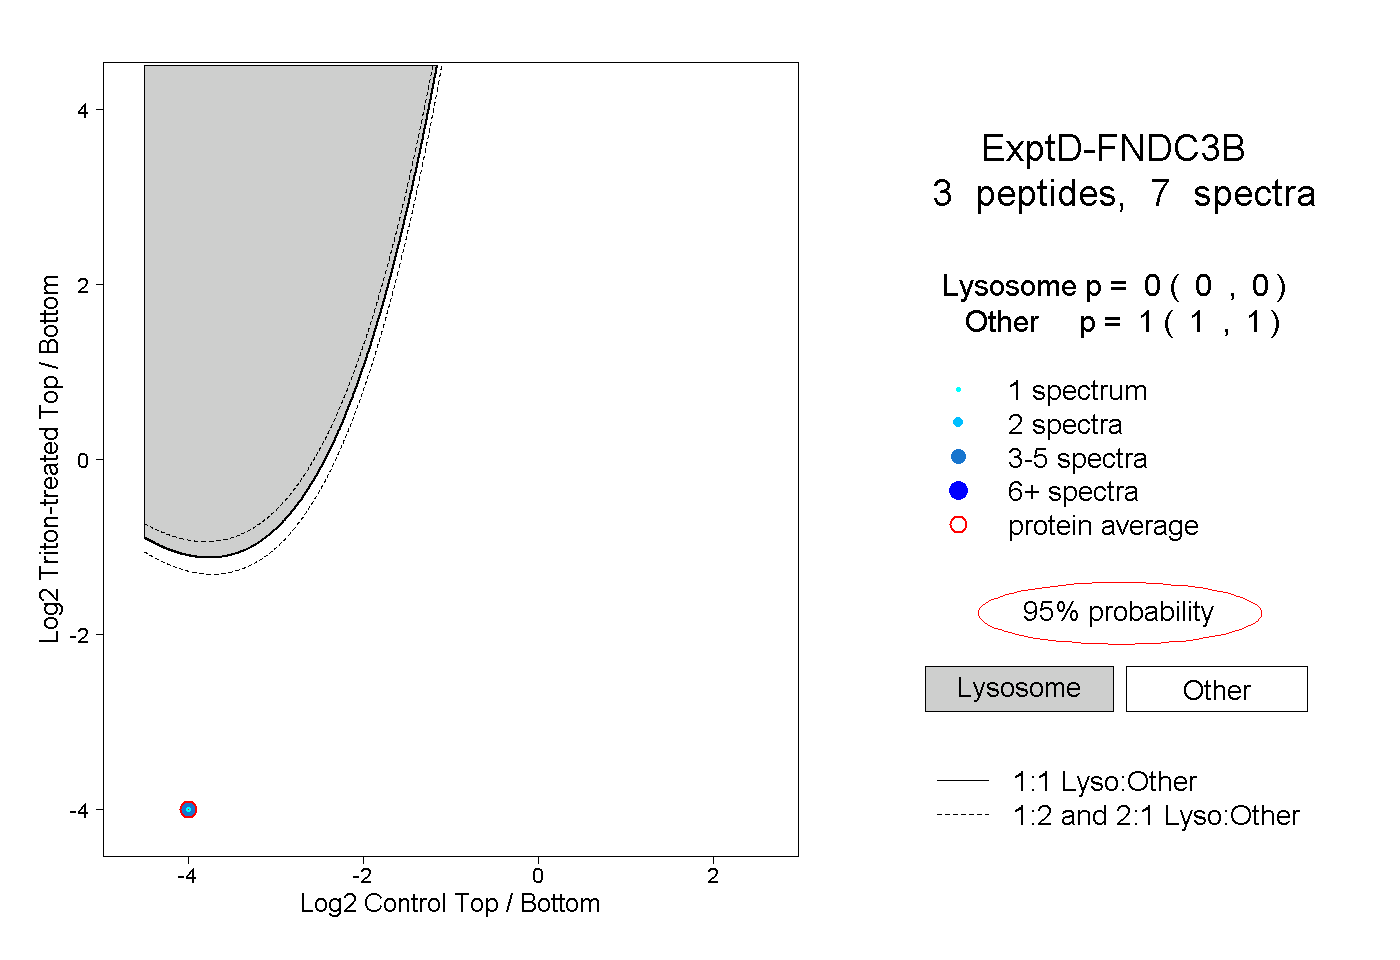
0.000 | 0.000
1.000 | 1.000