 10
10peptides
spectra
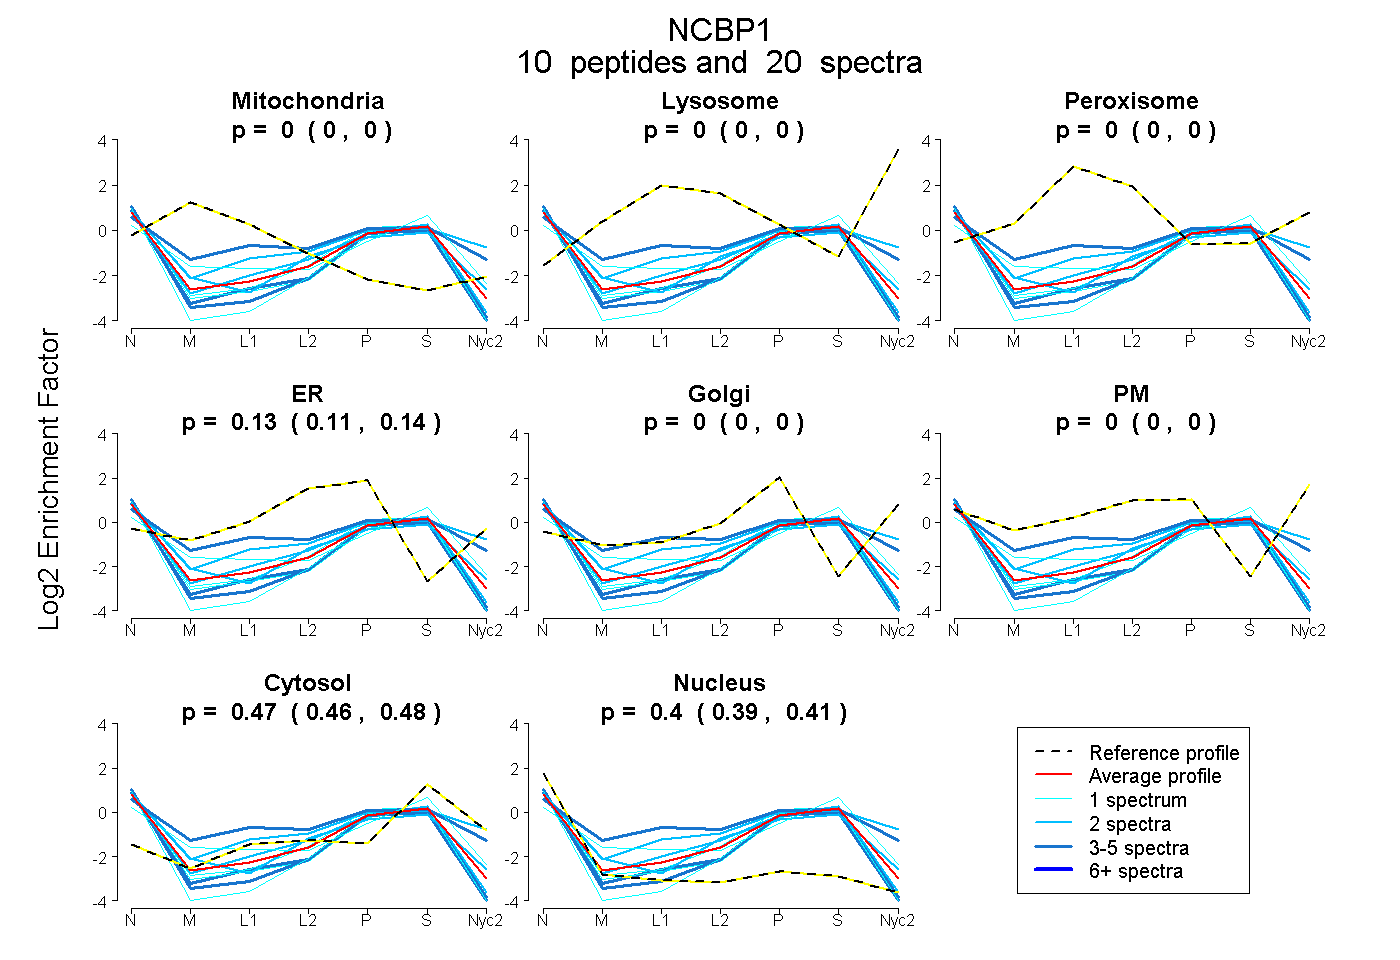
0.000 | 0.000
0.000 | 0.000
0.000 | 0.000
0.114 | 0.135
0.000 | 0.000
0.000 | 0.000
0.461 | 0.481
0.388 | 0.414
2peptides
spectra
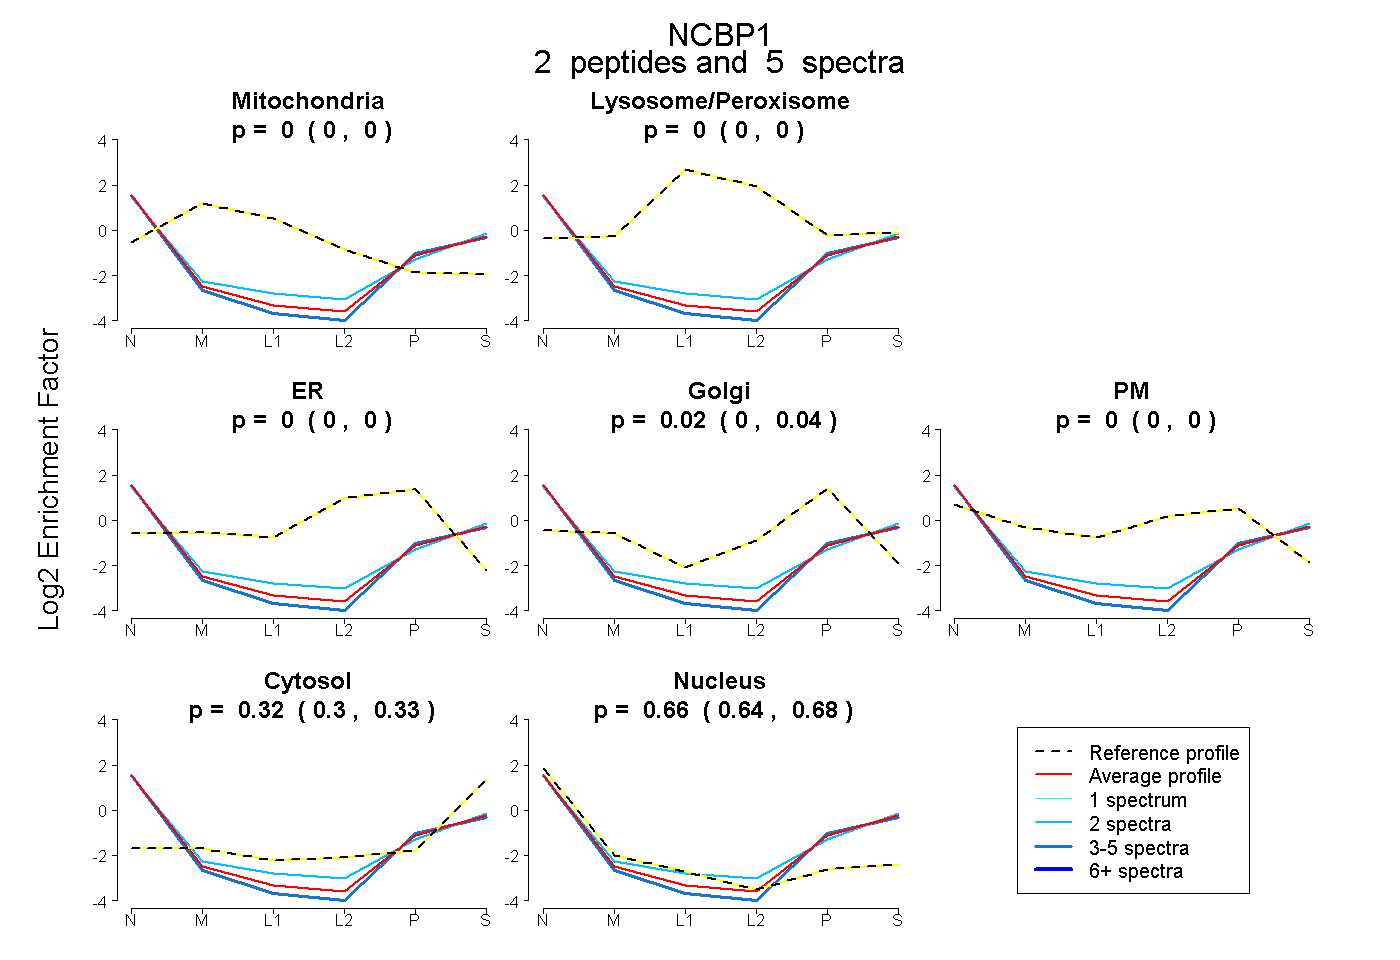
0.000 | 0.000
0.000 | 0.000
0.000 | 0.000
0.001 | 0.044
0.000 | 0.000
0.301 | 0.326
0.639 | 0.679