 3
3peptides
spectra
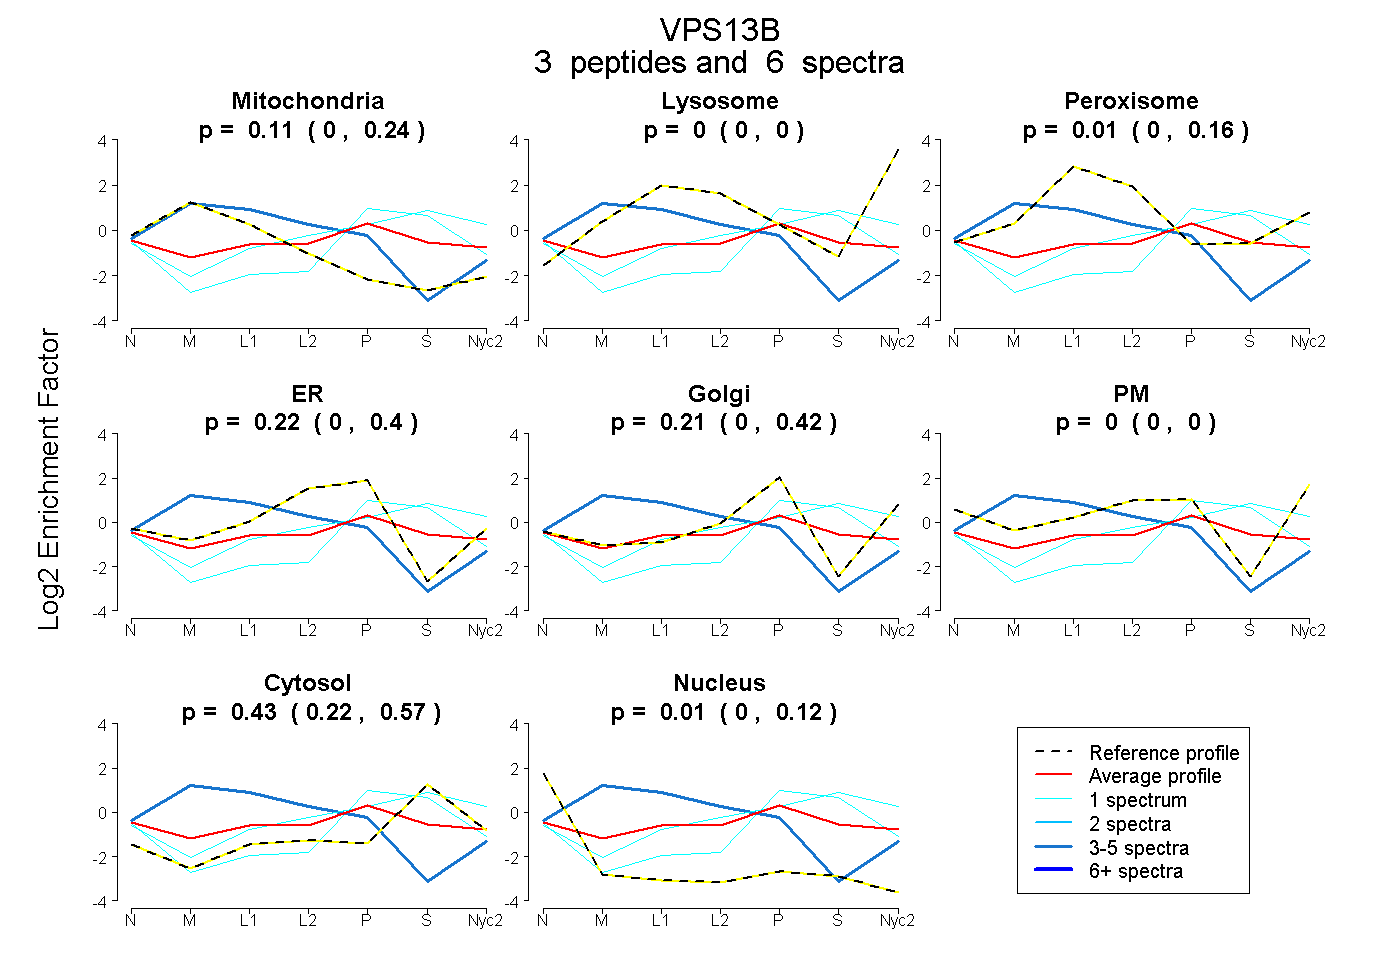
0.000 | 0.235
0.000 | 0.000
0.000 | 0.160
0.000 | 0.401
0.000 | 0.421
0.000 | 0.001
0.219 | 0.571
0.000 | 0.124
2peptides
spectra
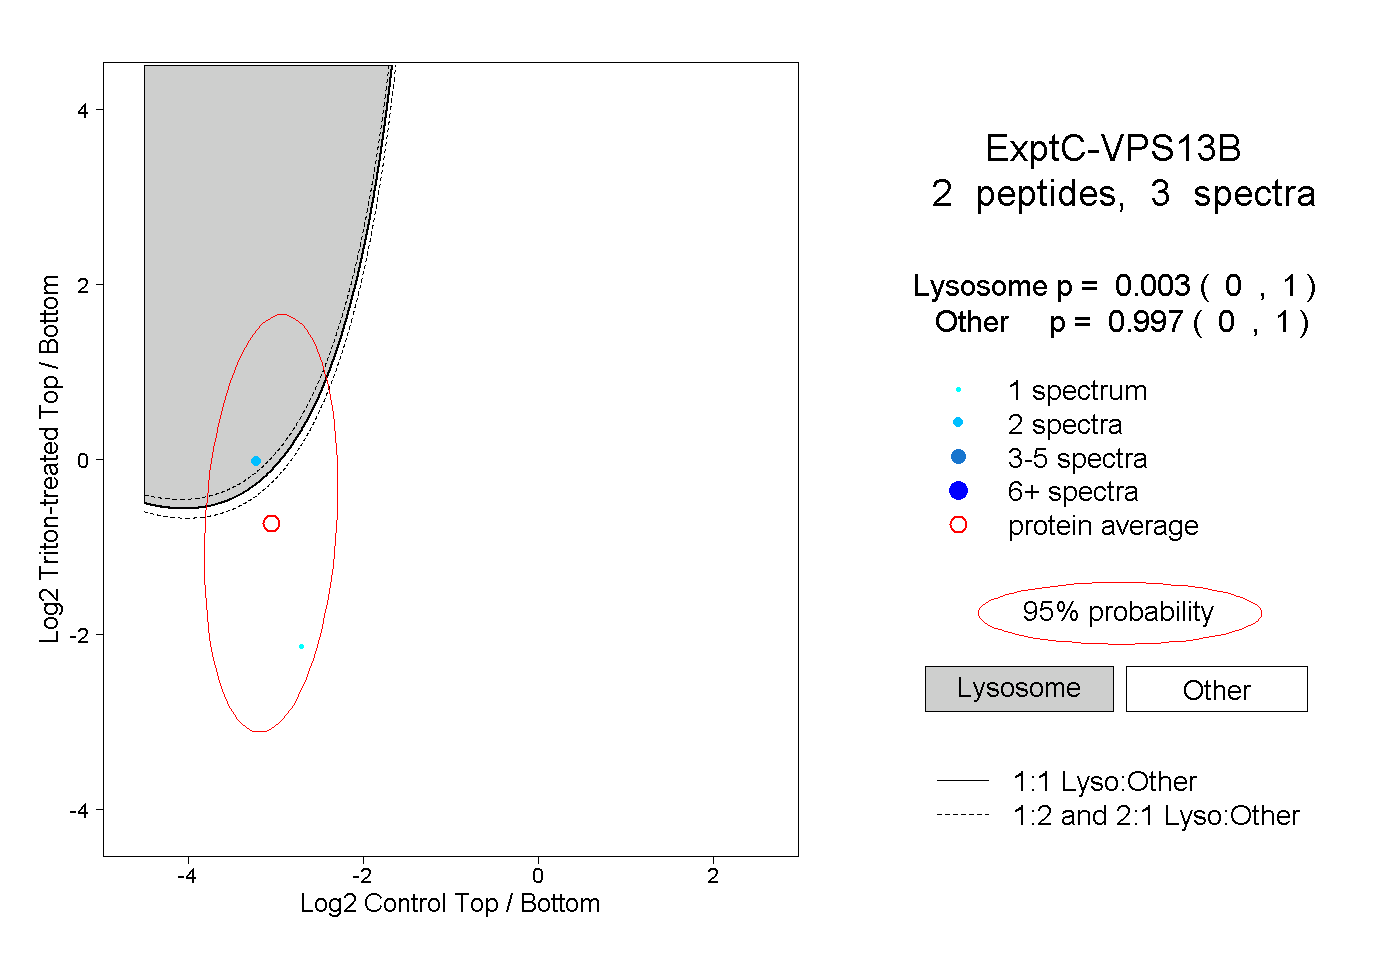
0.000 | 1.000
0.000 | 1.000
1peptide
spectrum
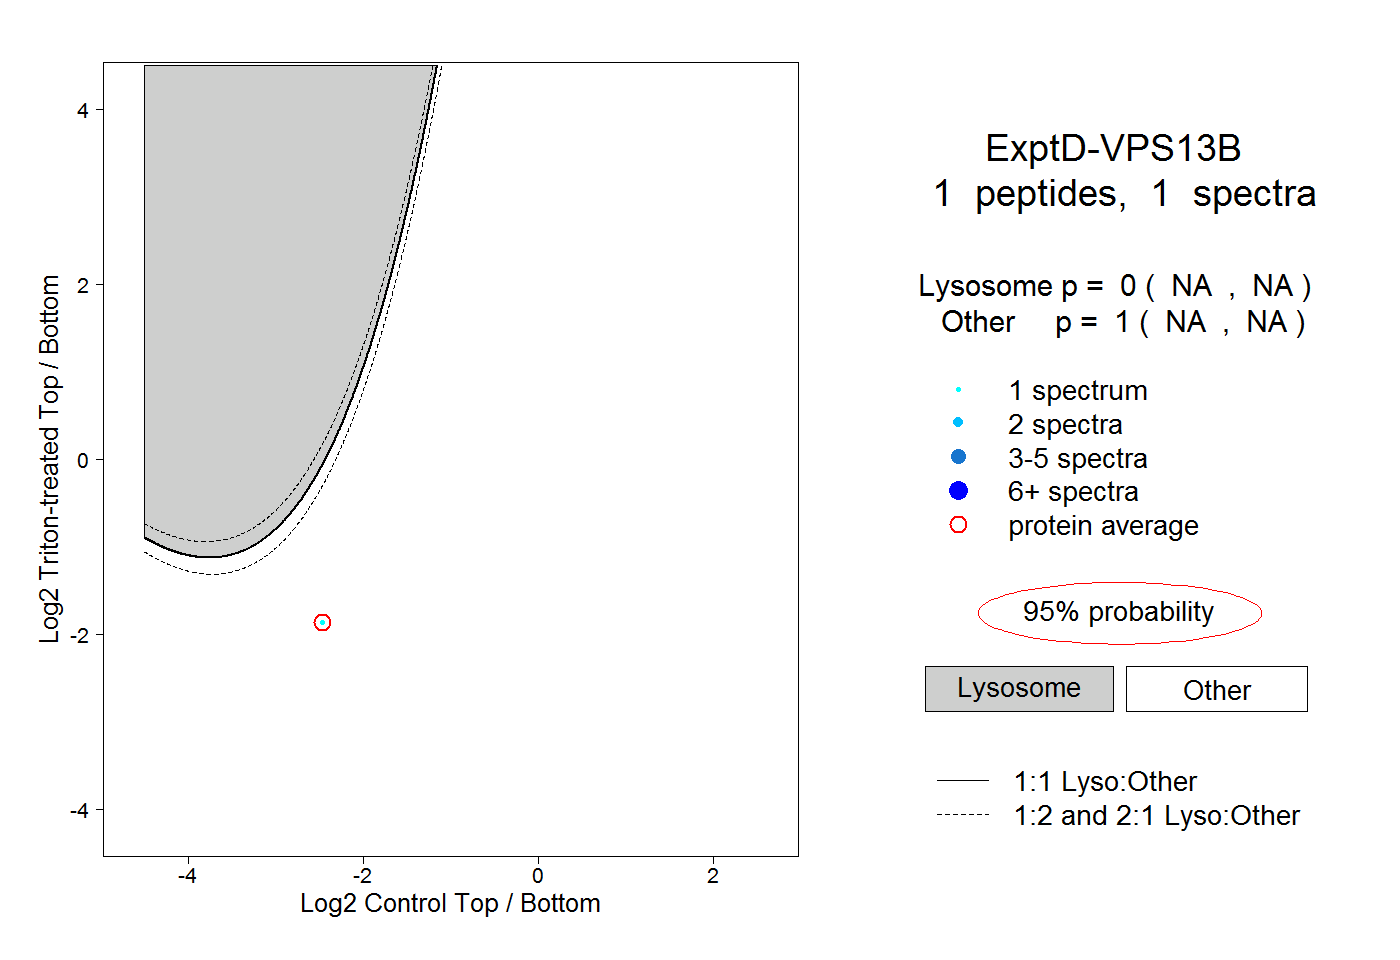
NA | NA
NA | NA