 3
3peptides
spectra
0.000 | 0.235
0.000 | 0.000
0.000 | 0.160
0.000 | 0.401
0.000 | 0.421
0.000 | 0.001
0.219 | 0.571
0.000 | 0.124
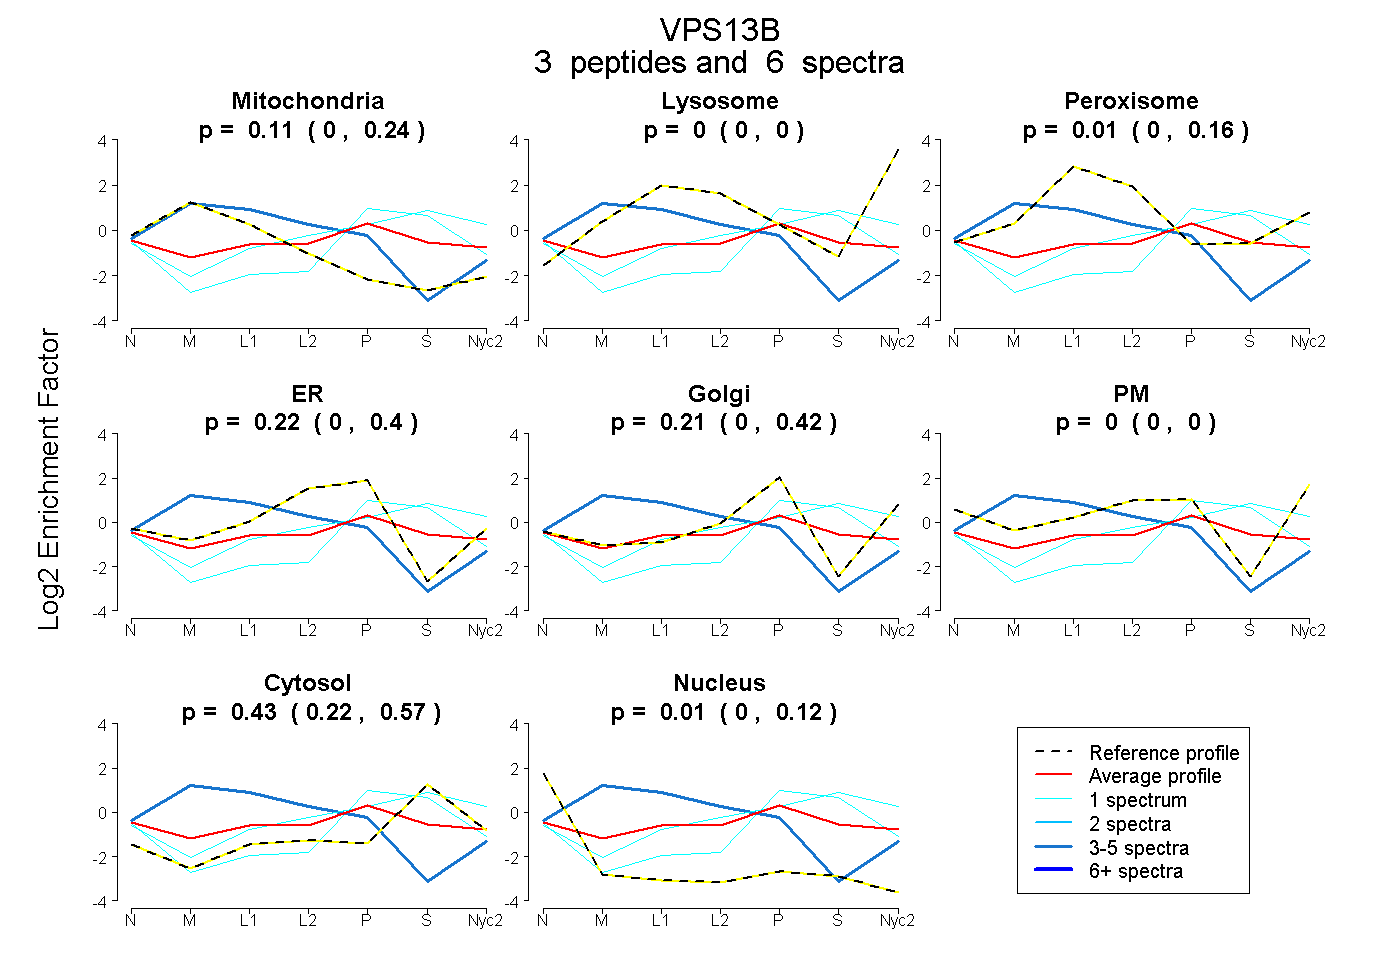
| Plot | Mito | Lyso | Perox | ER | Golgi | PM | Cytosol | Nucleus | |||||
| Expt A |
3 peptides |
6 spectra |
|
0.113 0.000 | 0.235 |
0.000 0.000 | 0.000 |
0.014 0.000 | 0.160 |
0.216 0.000 | 0.401 |
0.212 0.000 | 0.421 |
0.000 0.000 | 0.001 |
0.435 0.219 | 0.571 |
0.010 0.000 | 0.124 |
| 4 spectra, ENCFIK | 0.566 | 0.000 | 0.079 | 0.355 | 0.000 | 0.000 | 0.000 | 0.000 | ||
| 1 spectrum, DPGSEIEDR | 0.000 | 0.000 | 0.000 | 0.000 | 0.276 | 0.000 | 0.645 | 0.079 | ||
| 1 spectrum, LDVLEQELK | 0.000 | 0.086 | 0.000 | 0.022 | 0.100 | 0.150 | 0.642 | 0.000 |
| Plot | Lyso | Other | |||||||||||
| Expt C |
2 peptides |
3 spectra |
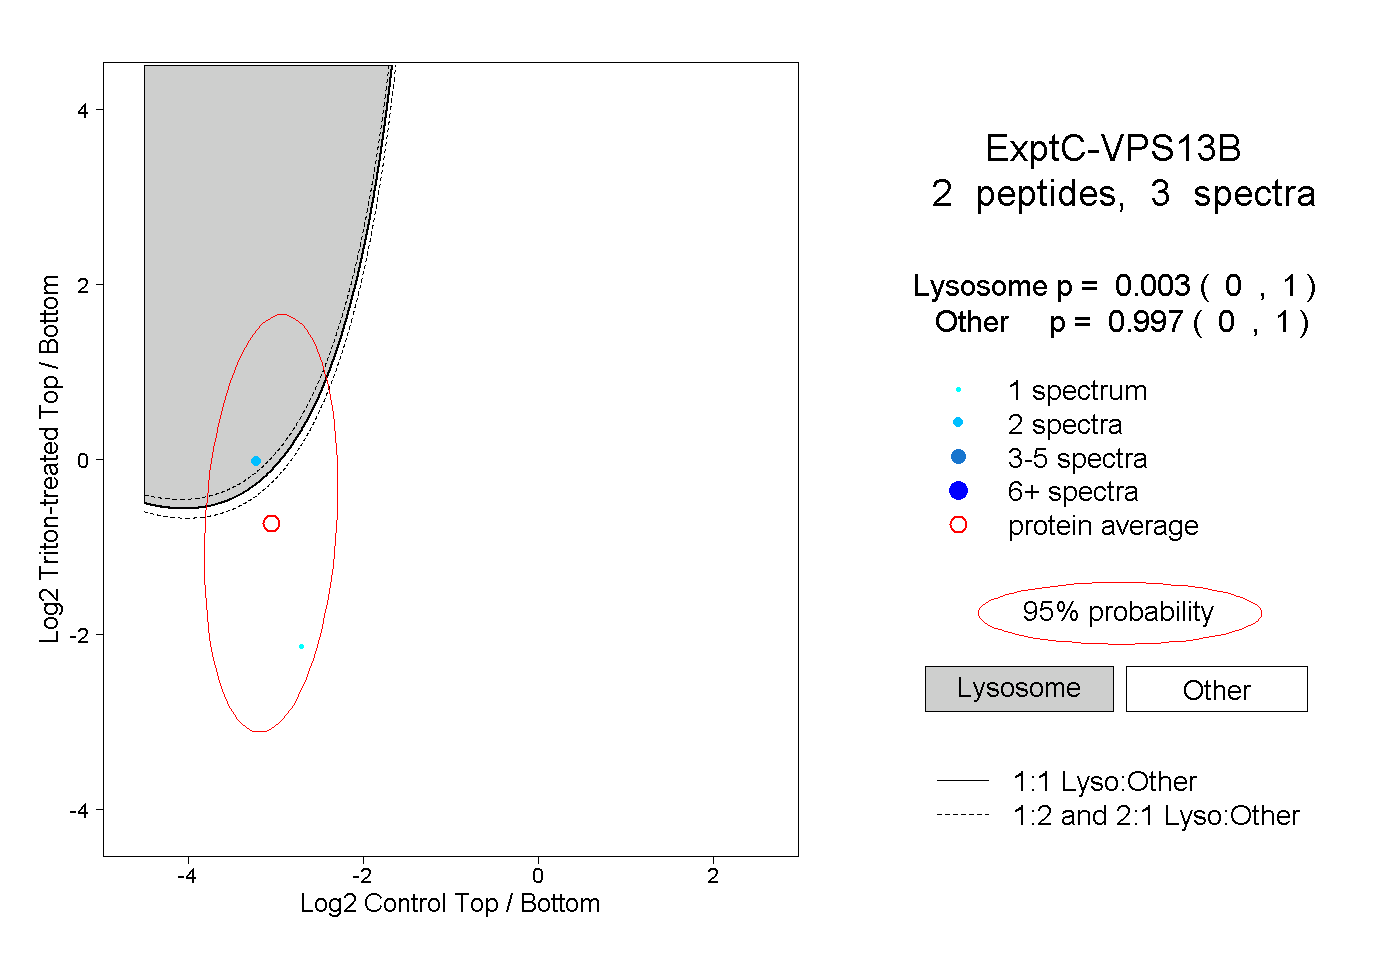 |
0.003 0.000 | 1.000 |
0.997 0.000 | 1.000 |
||||||||
| Plot | Lyso | Other | |||||||||||
| Expt D |
1 peptide |
1 spectrum |
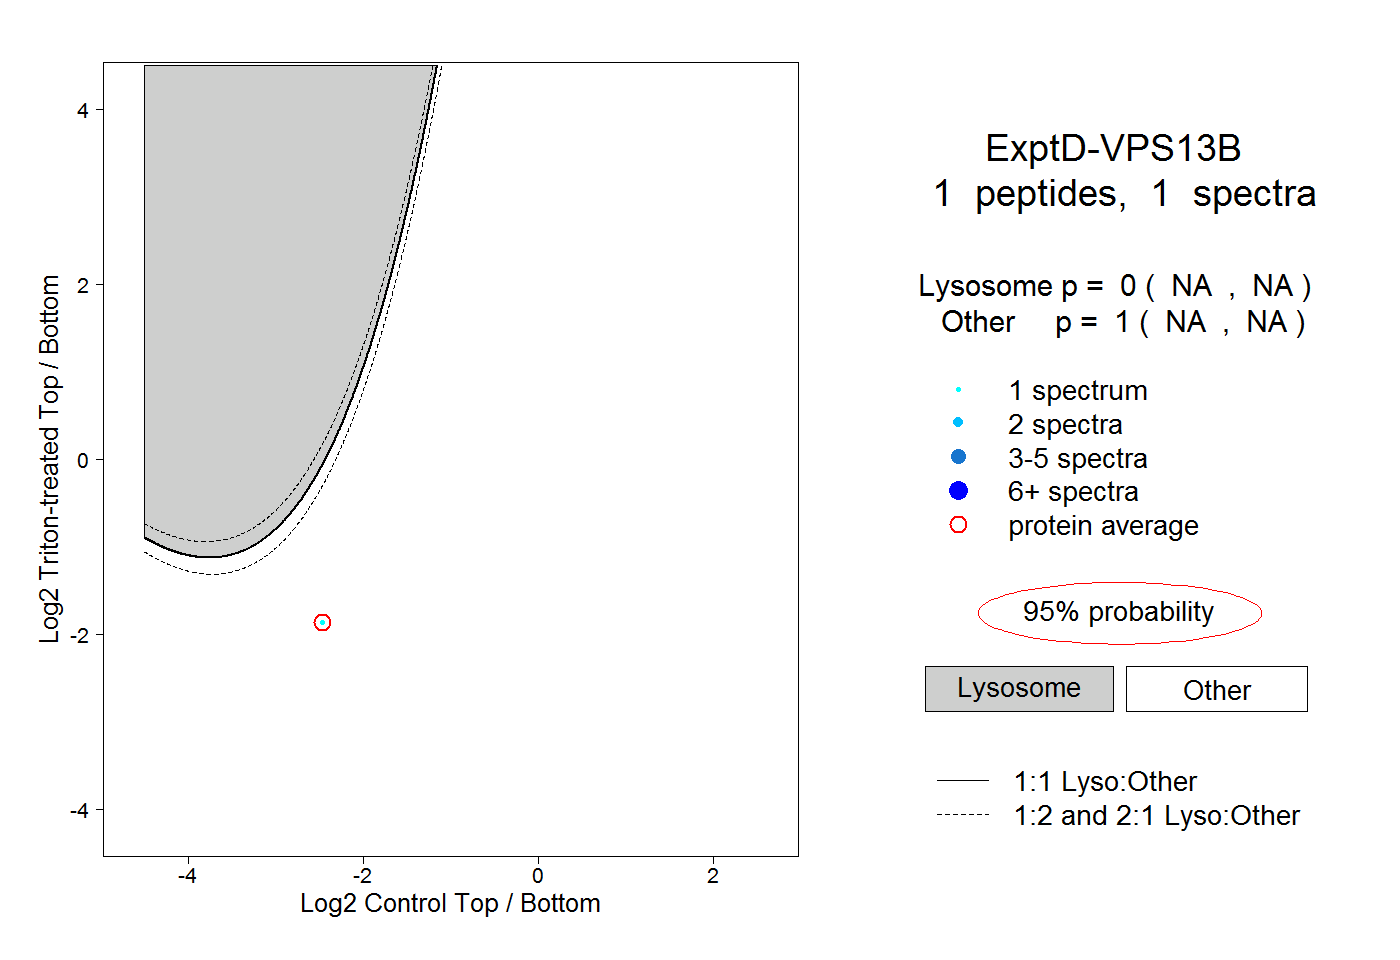 |
0.000 NA | NA |
1.000 NA | NA |