 9
9peptides
spectra
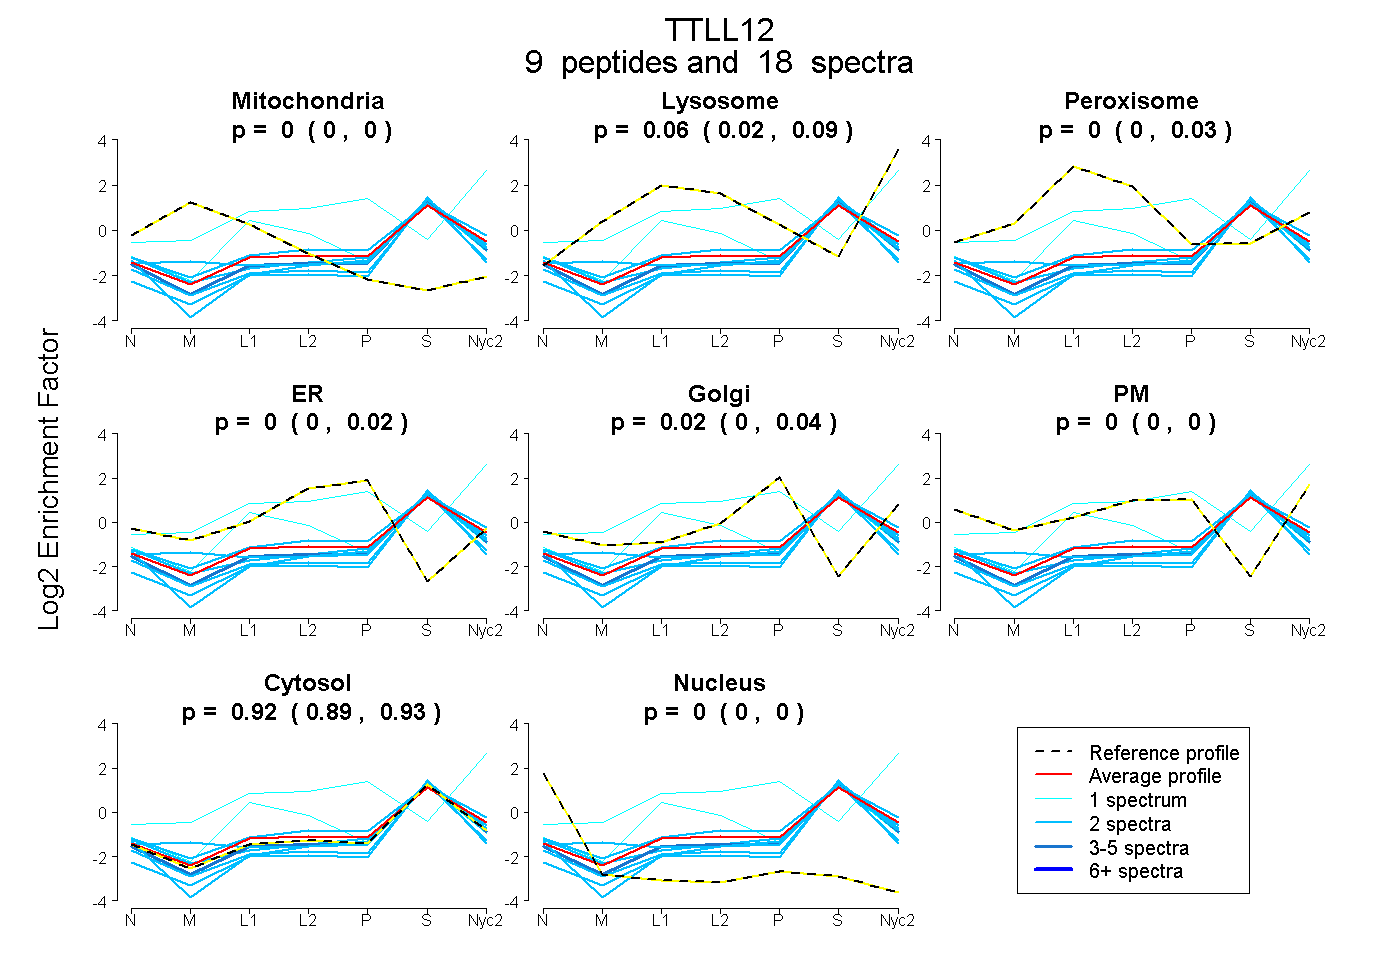
0.000 | 0.000
0.019 | 0.087
0.000 | 0.030
0.000 | 0.017
0.000 | 0.043
0.000 | 0.003
0.894 | 0.934
0.000 | 0.000
4peptides
spectra
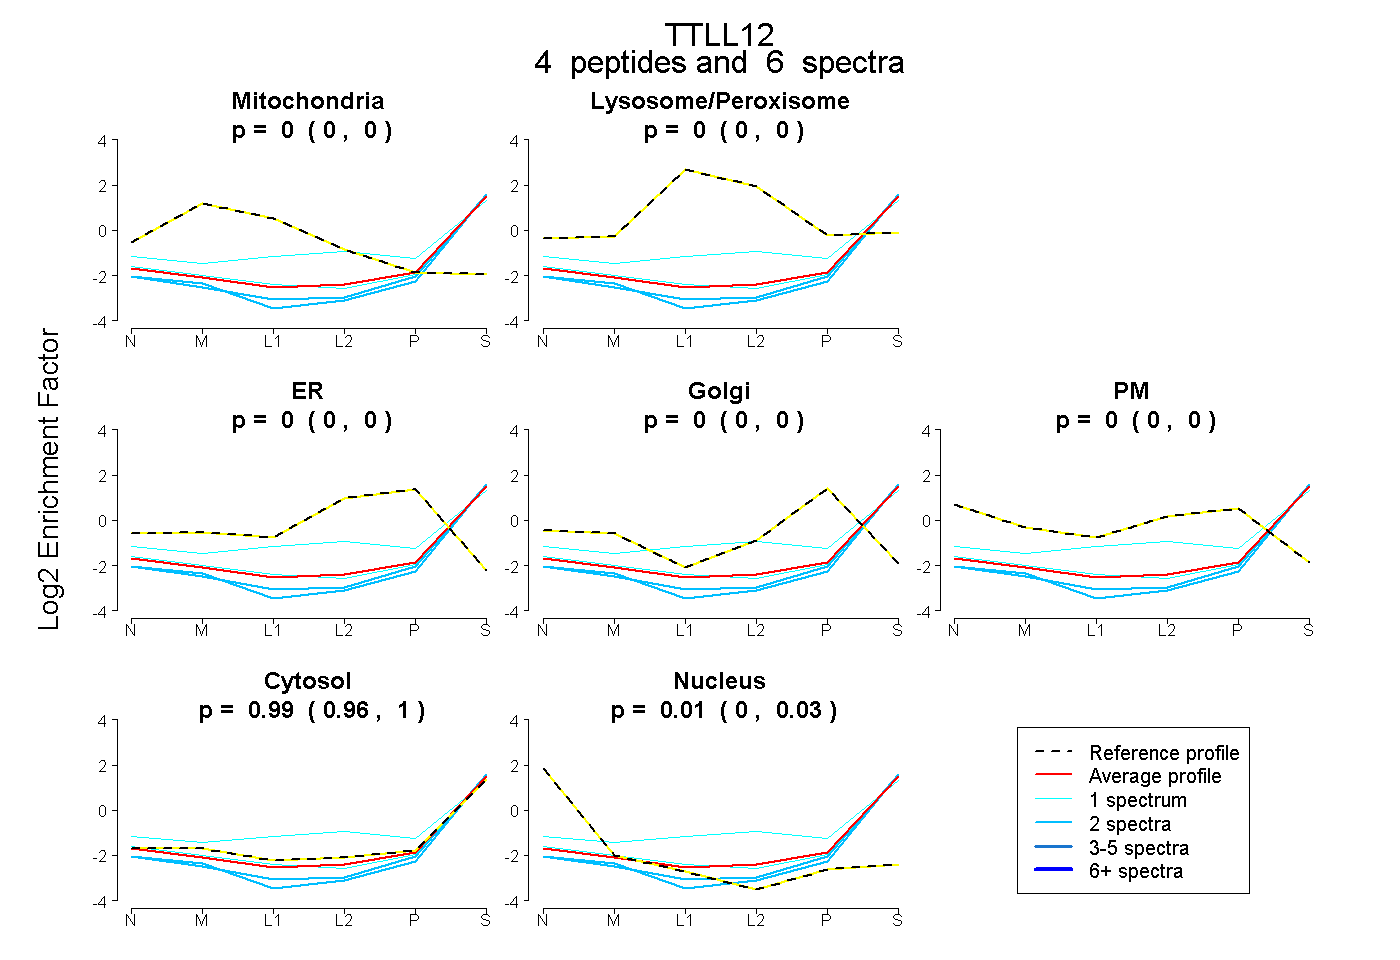
0.000 | 0.000
0.000 | 0.000
0.000 | 0.000
0.000 | 0.000
0.000 | 0.000
0.962 | 1.000
0.000 | 0.031
5peptides
spectra
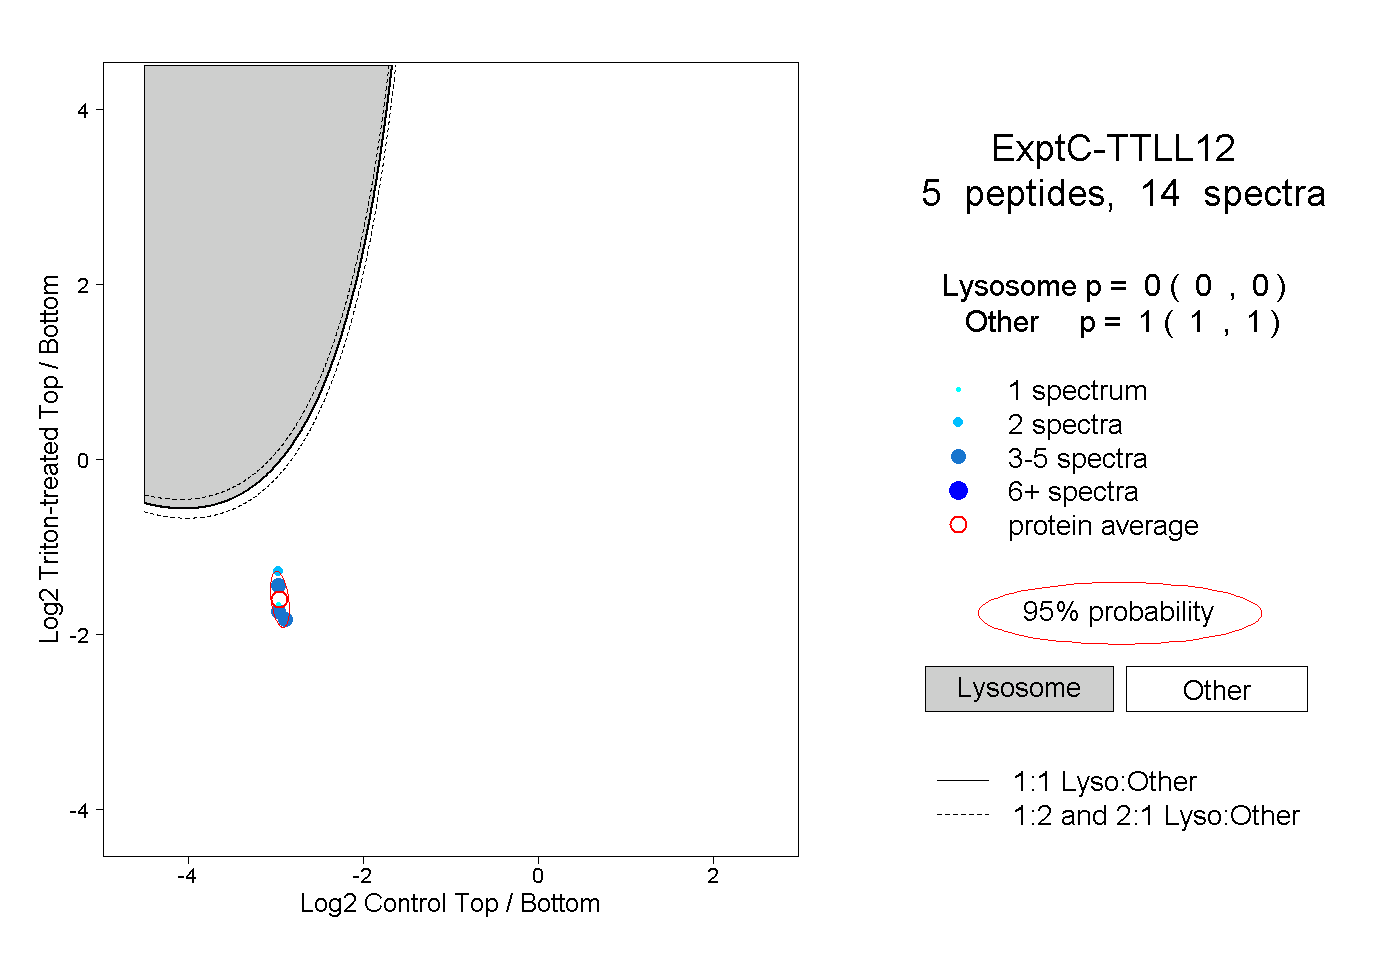
0.000 | 0.000
1.000 | 1.000