 9
9peptides
spectra
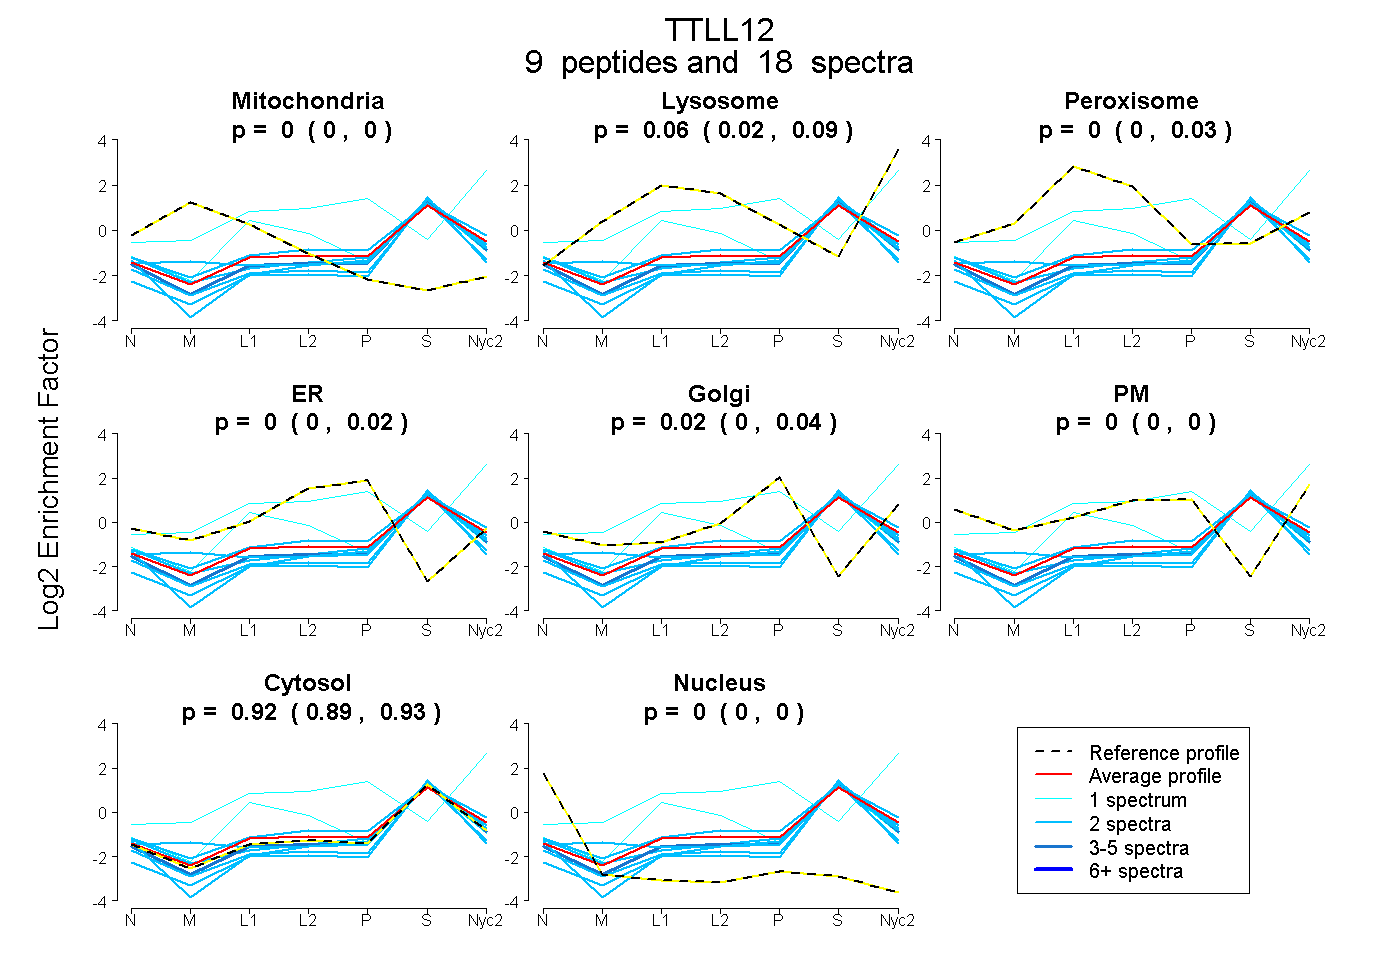
0.000 | 0.000
0.019 | 0.087
0.000 | 0.030
0.000 | 0.017
0.000 | 0.043
0.000 | 0.003
0.894 | 0.934
0.000 | 0.000
| Plot | Mito | Lyso | Perox | ER | Golgi | PM | Cytosol | Nucleus | |||||
| Expt A |
9 peptides |
18 spectra |
|
0.000 0.000 | 0.000 |
0.065 0.019 | 0.087 |
0.000 0.000 | 0.030 |
0.000 0.000 | 0.017 |
0.017 0.000 | 0.043 |
0.000 0.000 | 0.003 |
0.918 0.894 | 0.934 |
0.000 0.000 | 0.000 |
| 1 spectrum, ADDPNSIFLIDHAWTCR | 0.000 | 0.000 | 0.293 | 0.000 | 0.000 | 0.000 | 0.707 | 0.000 | ||
| 2 spectra, YIESPVLFFR | 0.000 | 0.000 | 0.000 | 0.000 | 0.000 | 0.000 | 0.978 | 0.022 | ||
| 2 spectra, QLQQVPGLLHR | 0.120 | 0.001 | 0.000 | 0.000 | 0.000 | 0.000 | 0.879 | 0.000 | ||
| 2 spectra, ASGVPER | 0.000 | 0.100 | 0.000 | 0.000 | 0.006 | 0.035 | 0.859 | 0.000 | ||
| 2 spectra, YIVLLR | 0.000 | 0.000 | 0.000 | 0.000 | 0.000 | 0.000 | 0.984 | 0.016 | ||
| 2 spectra, AIYAIDLMLK | 0.000 | 0.000 | 0.000 | 0.000 | 0.000 | 0.000 | 0.968 | 0.032 | ||
| 4 spectra, DLDTGEEVTR | 0.000 | 0.000 | 0.000 | 0.000 | 0.000 | 0.000 | 0.998 | 0.002 | ||
| 2 spectra, DCLASIAR | 0.000 | 0.000 | 0.000 | 0.000 | 0.000 | 0.000 | 0.945 | 0.055 | ||
| 1 spectrum, LWGSLLHK | 0.000 | 0.583 | 0.000 | 0.000 | 0.248 | 0.082 | 0.088 | 0.000 |
| Plot | Mito | Lyso or Perox | ER | Golgi | PM | Cytosol | Nucleus | ||||||
| Expt B |
4 peptides |
6 spectra |
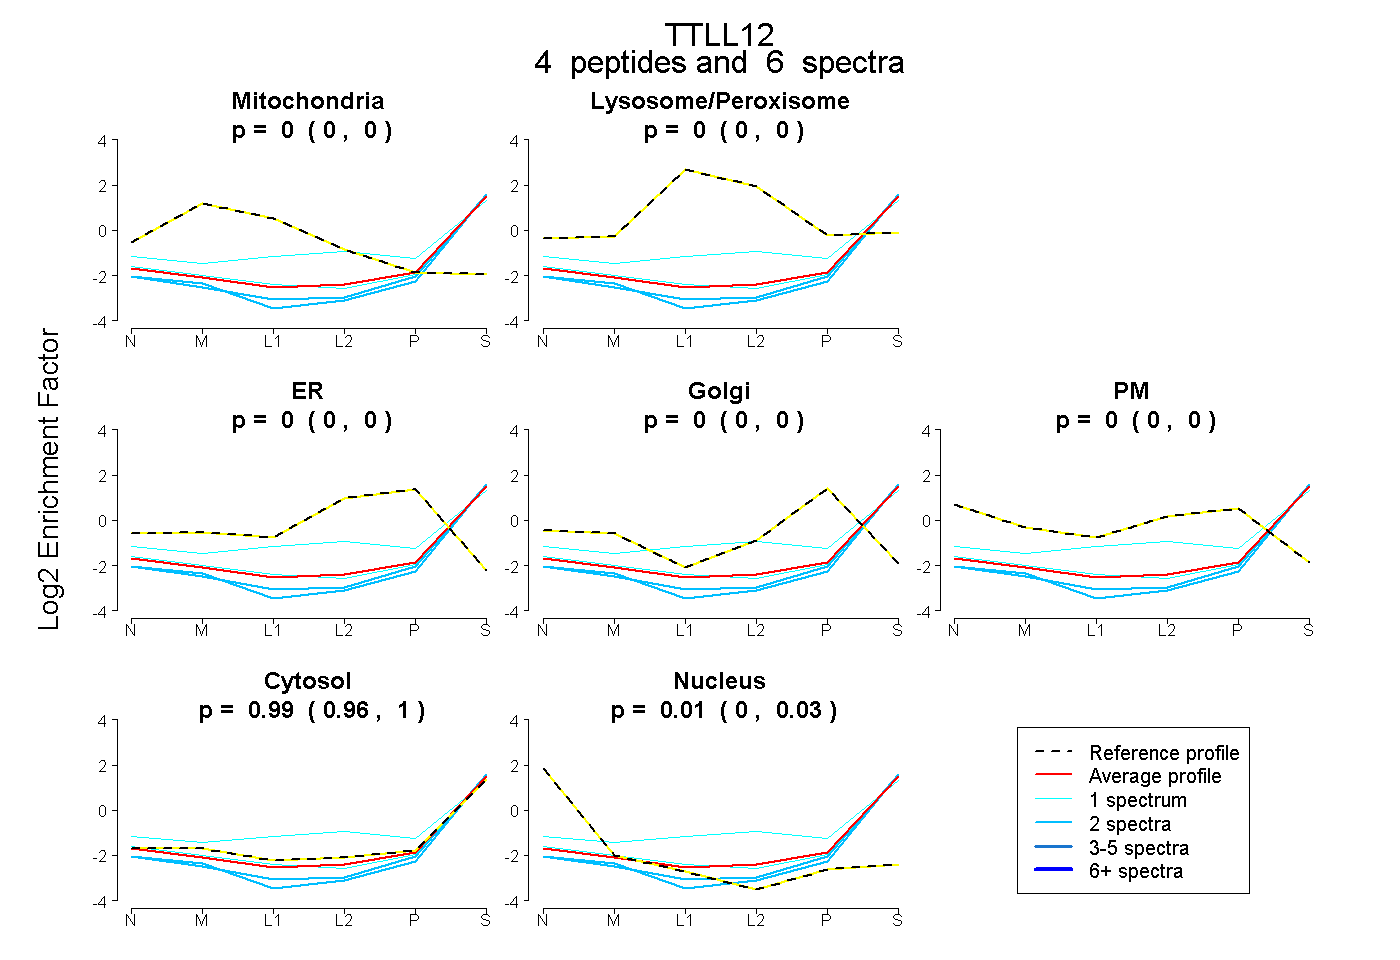 |
0.000 0.000 | 0.000 |
0.000 0.000 | 0.000 |
0.000 0.000 | 0.000 |
0.000 0.000 | 0.000 |
0.000 0.000 | 0.000 |
0.990 0.962 | 1.000 |
0.010 0.000 | 0.031 |
|||
| Plot | Lyso | Other | |||||||||||
| Expt C |
5 peptides |
14 spectra |
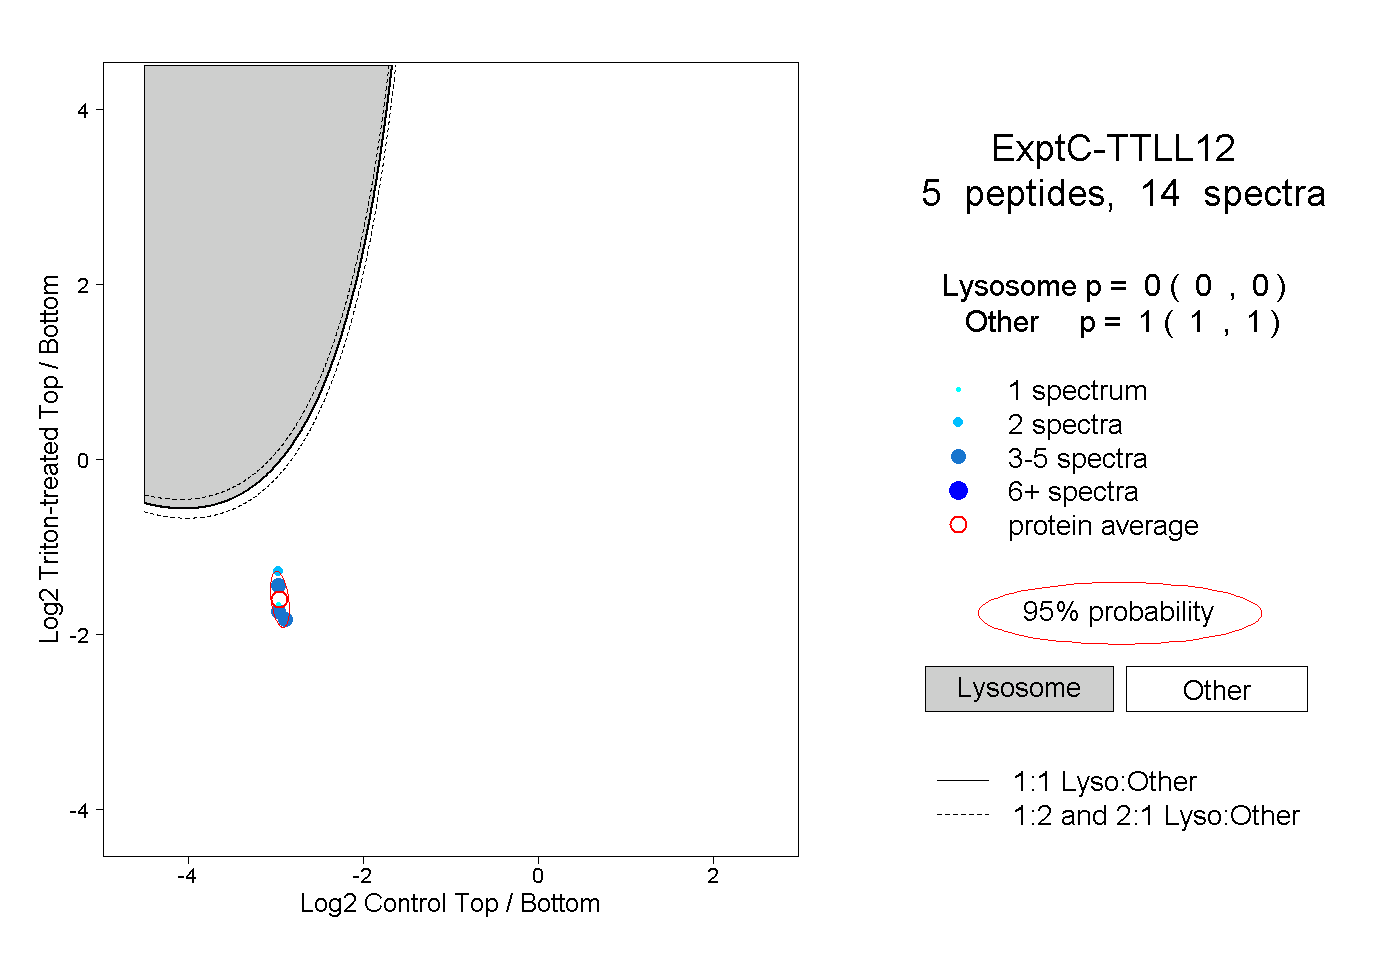 |
0.000 0.000 | 0.000 |
1.000 1.000 | 1.000 |