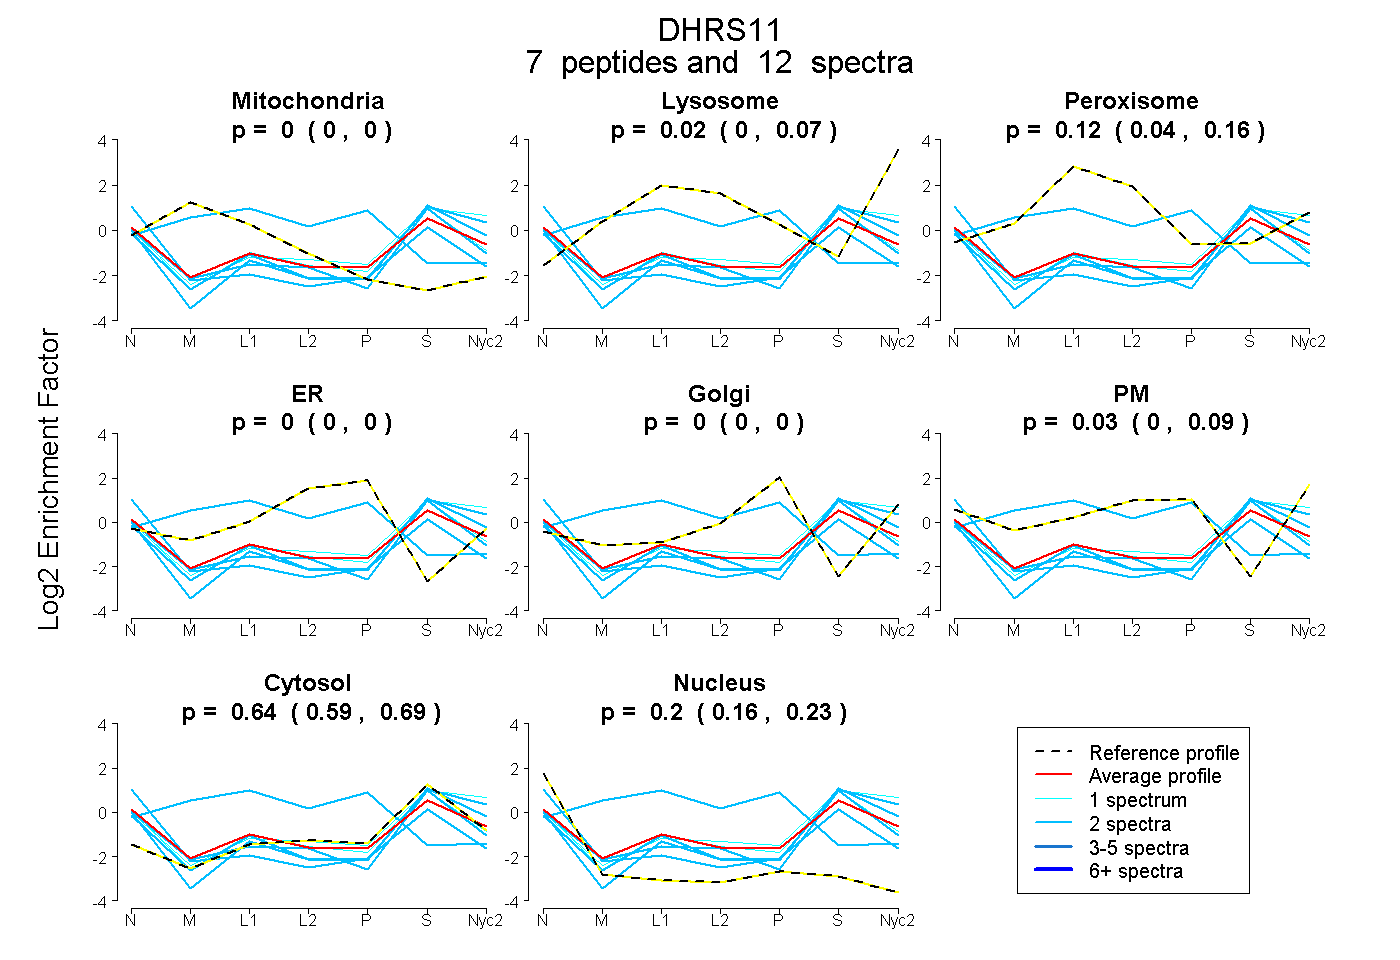
 7
7peptides
spectra
0.000 | 0.000
0.000 | 0.075
0.042 | 0.162
0.000 | 0.000
0.000 | 0.000
0.000 | 0.085
0.586 | 0.687
0.160 | 0.232
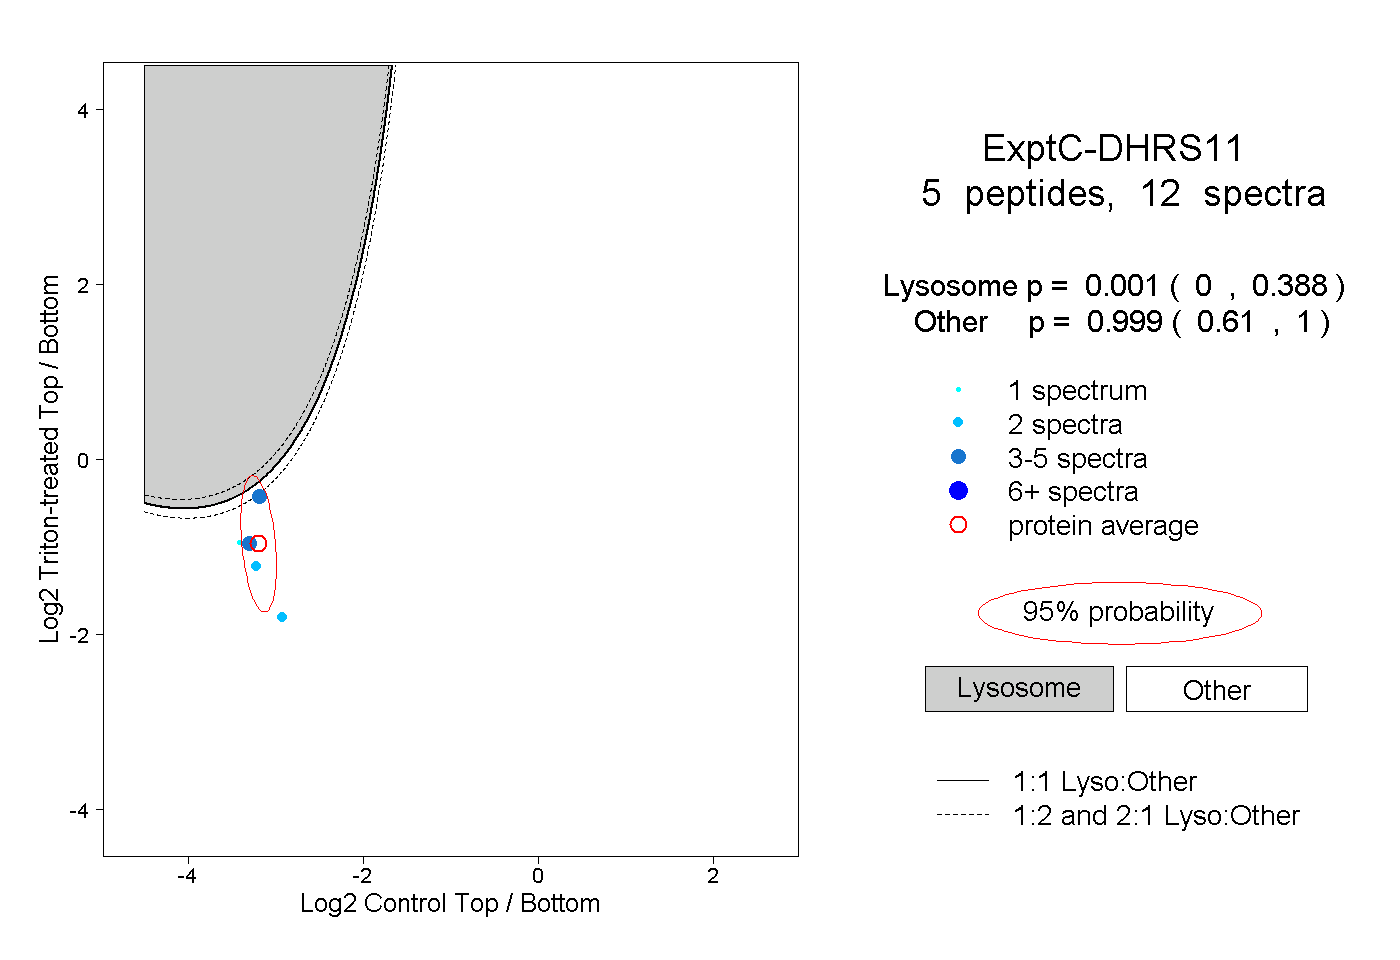
5peptides
spectra
0.000 | 0.388
0.610 | 1.000
| Plot | Mito | Lyso | Perox | ER | Golgi | PM | Cytosol | Nucleus | |||||
| Expt A |
7 peptides |
12 spectra |
|
0.000 0.000 | 0.000 |
0.016 0.000 | 0.075 |
0.117 0.042 | 0.162 |
0.000 0.000 | 0.000 |
0.000 0.000 | 0.000 |
0.027 0.000 | 0.085 |
0.641 0.586 | 0.687 |
0.199 0.160 | 0.232 |
||
| Plot | Lyso | Other | |||||||||||
| Expt C |
5 peptides |
12 spectra |
|
0.001 0.000 | 0.388 |
0.999 0.610 | 1.000 |