 7
7peptides
spectra
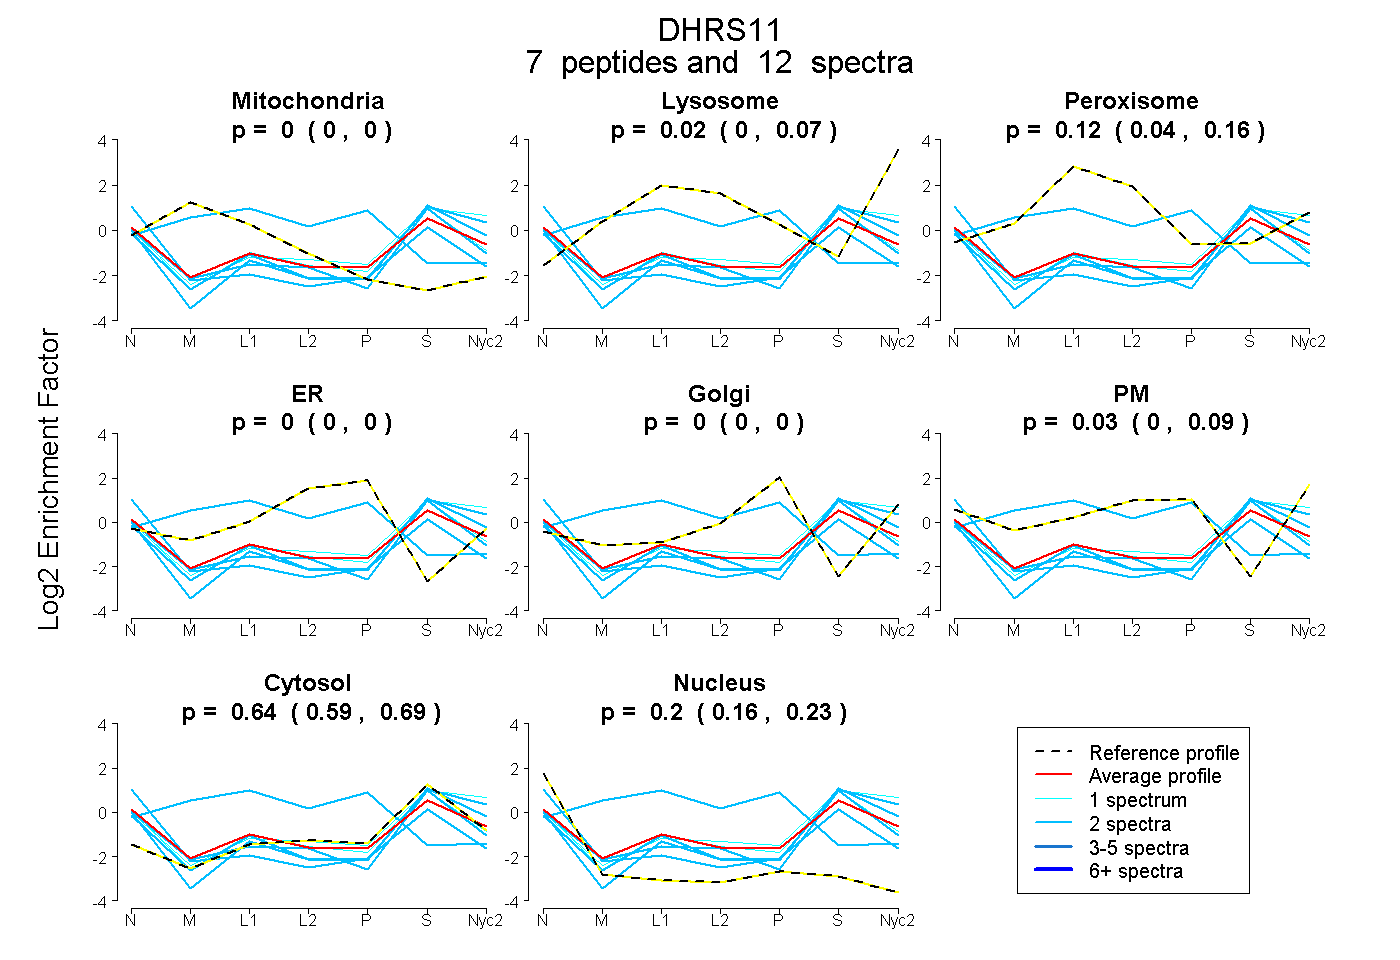
0.000 | 0.000
0.000 | 0.075
0.042 | 0.162
0.000 | 0.000
0.000 | 0.000
0.000 | 0.085
0.586 | 0.687
0.160 | 0.232
| Plot | Mito | Lyso | Perox | ER | Golgi | PM | Cytosol | Nucleus | |||||
| Expt A |
7 peptides |
12 spectra |
|
0.000 0.000 | 0.000 |
0.016 0.000 | 0.075 |
0.117 0.042 | 0.162 |
0.000 0.000 | 0.000 |
0.000 0.000 | 0.000 |
0.027 0.000 | 0.085 |
0.641 0.586 | 0.687 |
0.199 0.160 | 0.232 |
| 1 spectrum, ATCISPGLVETQFAFK | 0.000 | 0.000 | 0.092 | 0.000 | 0.000 | 0.007 | 0.756 | 0.145 | ||
| 2 spectra, QELLEAQTHIR | 0.340 | 0.000 | 0.173 | 0.461 | 0.000 | 0.000 | 0.026 | 0.000 | ||
| 2 spectra, LALVTGASGGIGAAVAR | 0.000 | 0.000 | 0.030 | 0.000 | 0.000 | 0.000 | 0.531 | 0.439 | ||
| 2 spectra, EAAATYEHIK | 0.002 | 0.000 | 0.046 | 0.000 | 0.000 | 0.000 | 0.744 | 0.207 | ||
| 1 spectrum, ALVQQGLK | 0.000 | 0.156 | 0.000 | 0.000 | 0.000 | 0.000 | 0.732 | 0.112 | ||
| 2 spectra, TVGNIEELAAECK | 0.000 | 0.000 | 0.000 | 0.000 | 0.000 | 0.000 | 0.857 | 0.143 | ||
| 2 spectra, SAGYPGTLIPYR | 0.000 | 0.086 | 0.000 | 0.000 | 0.000 | 0.000 | 0.799 | 0.115 |
| Plot | Lyso | Other | |||||||||||
| Expt C |
5 peptides |
12 spectra |
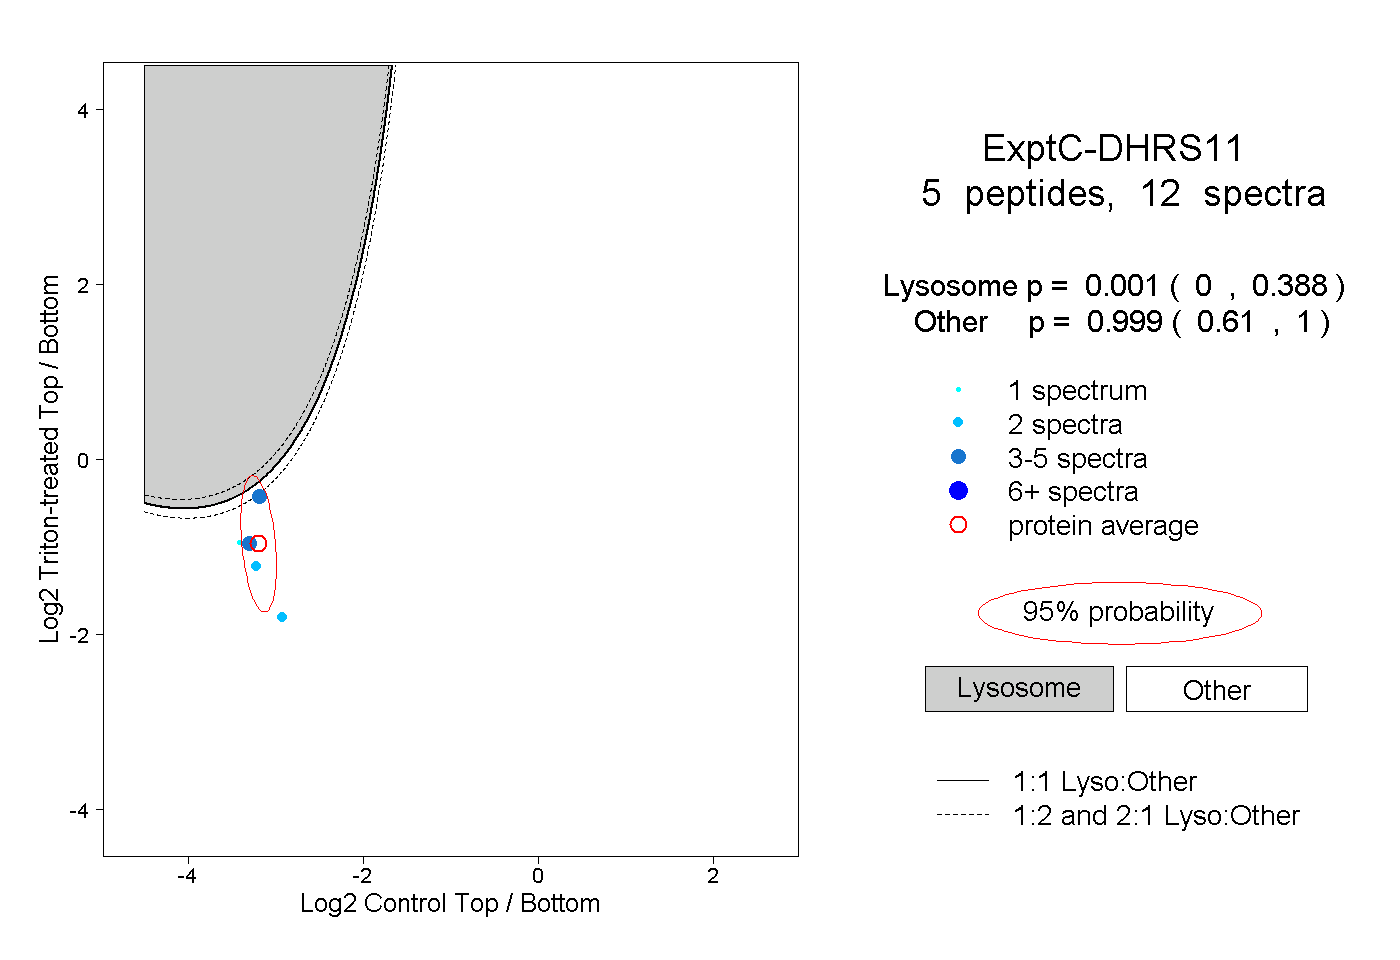 |
0.001 0.000 | 0.388 |
0.999 0.610 | 1.000 |