 5
5peptides
spectra
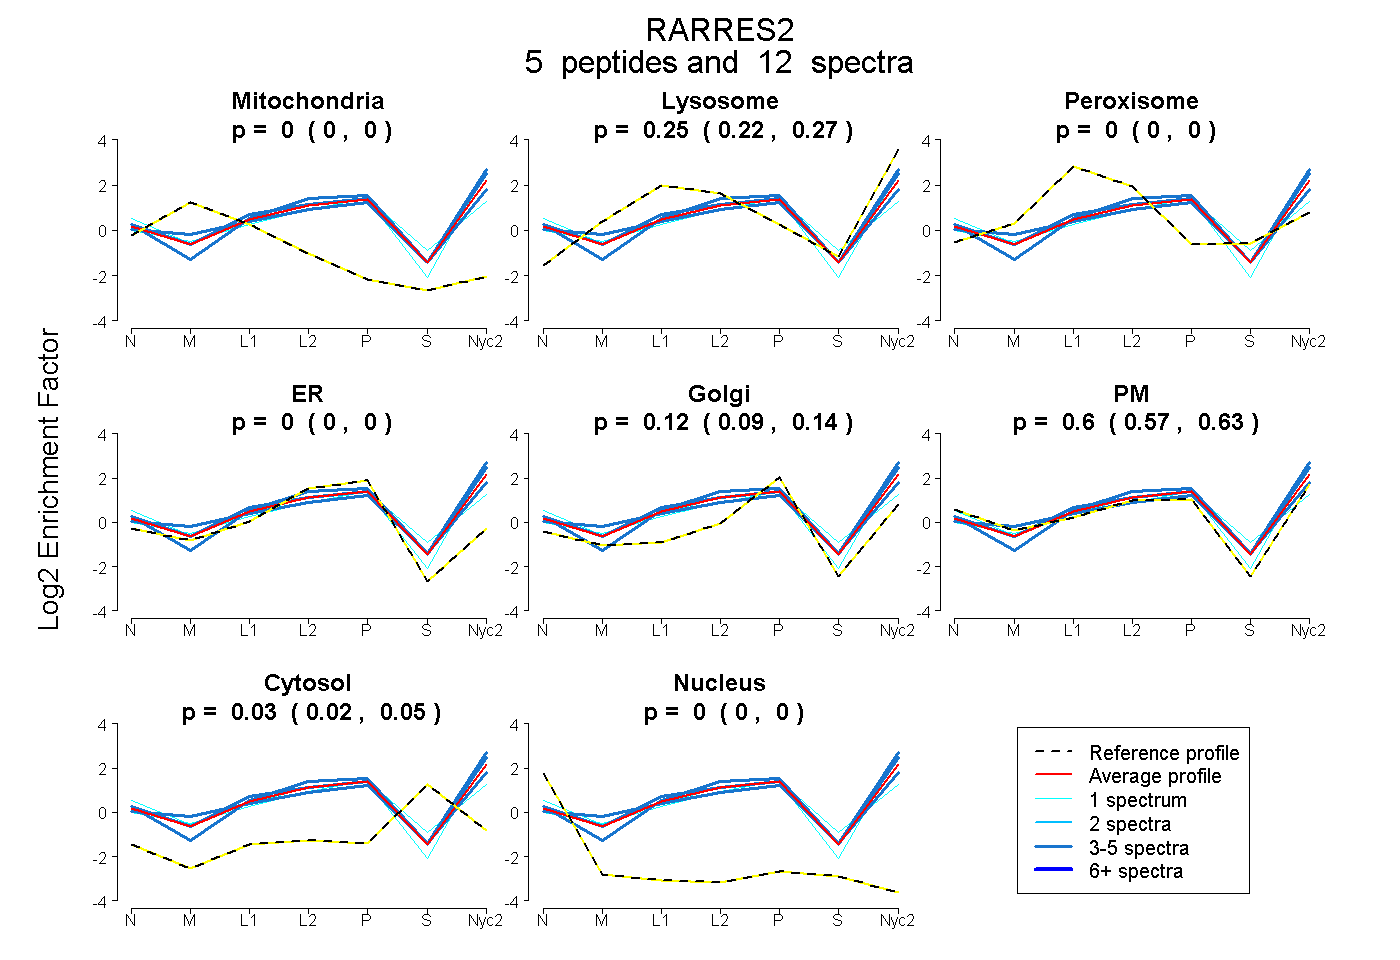
0.000 | 0.000
0.220 | 0.266
0.000 | 0.000
0.000 | 0.004
0.086 | 0.137
0.572 | 0.633
0.018 | 0.048
0.000 | 0.000
2peptides
spectra
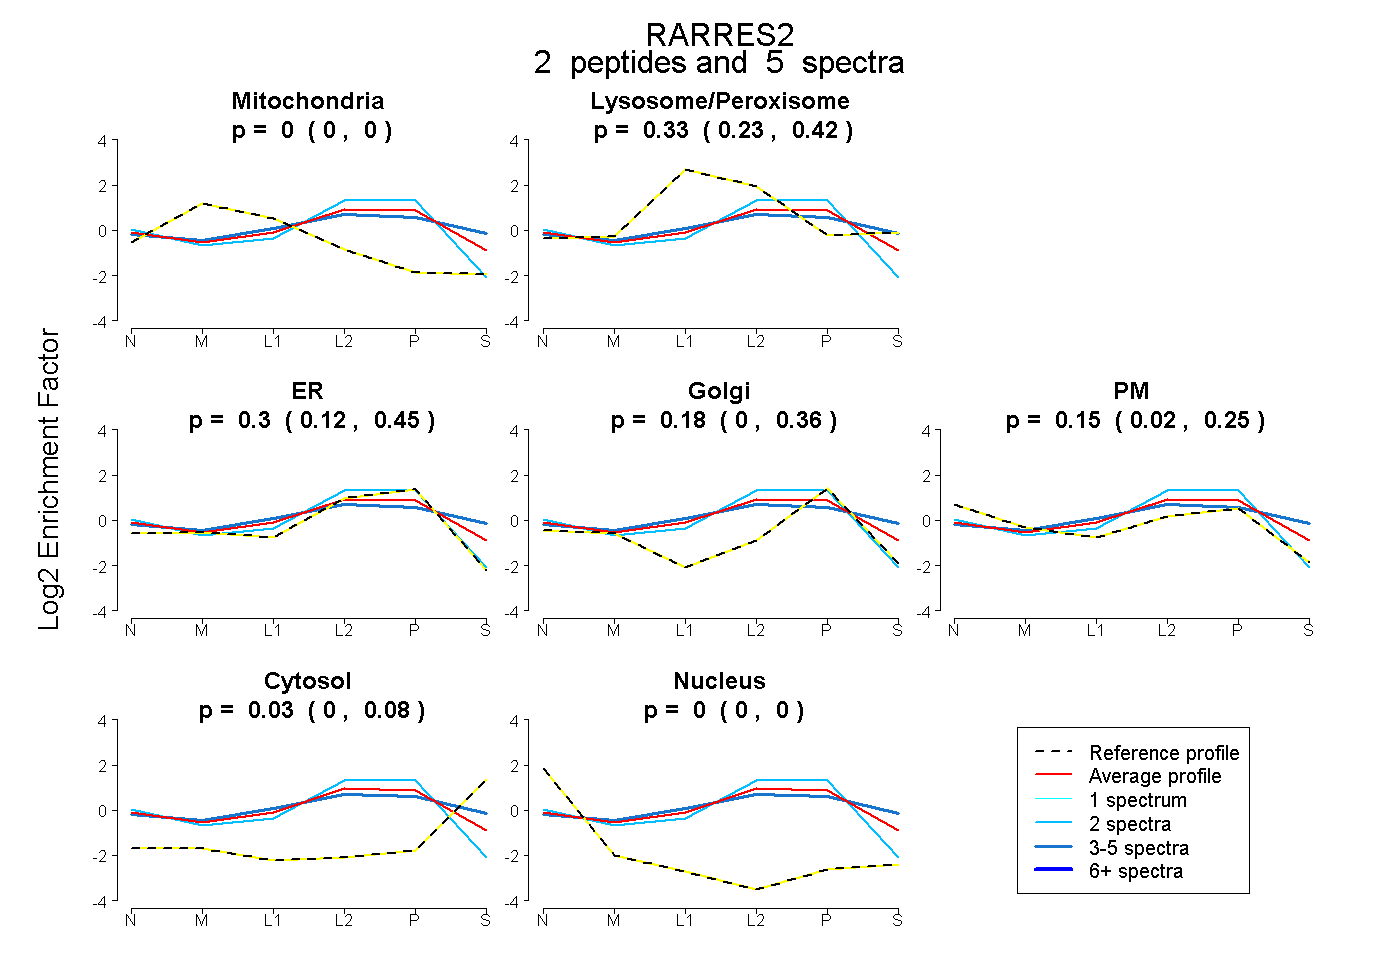
0.000 | 0.000
0.229 | 0.420
0.118 | 0.448
0.000 | 0.361
0.016 | 0.248
0.000 | 0.077
0.000 | 0.000
4peptides
spectra
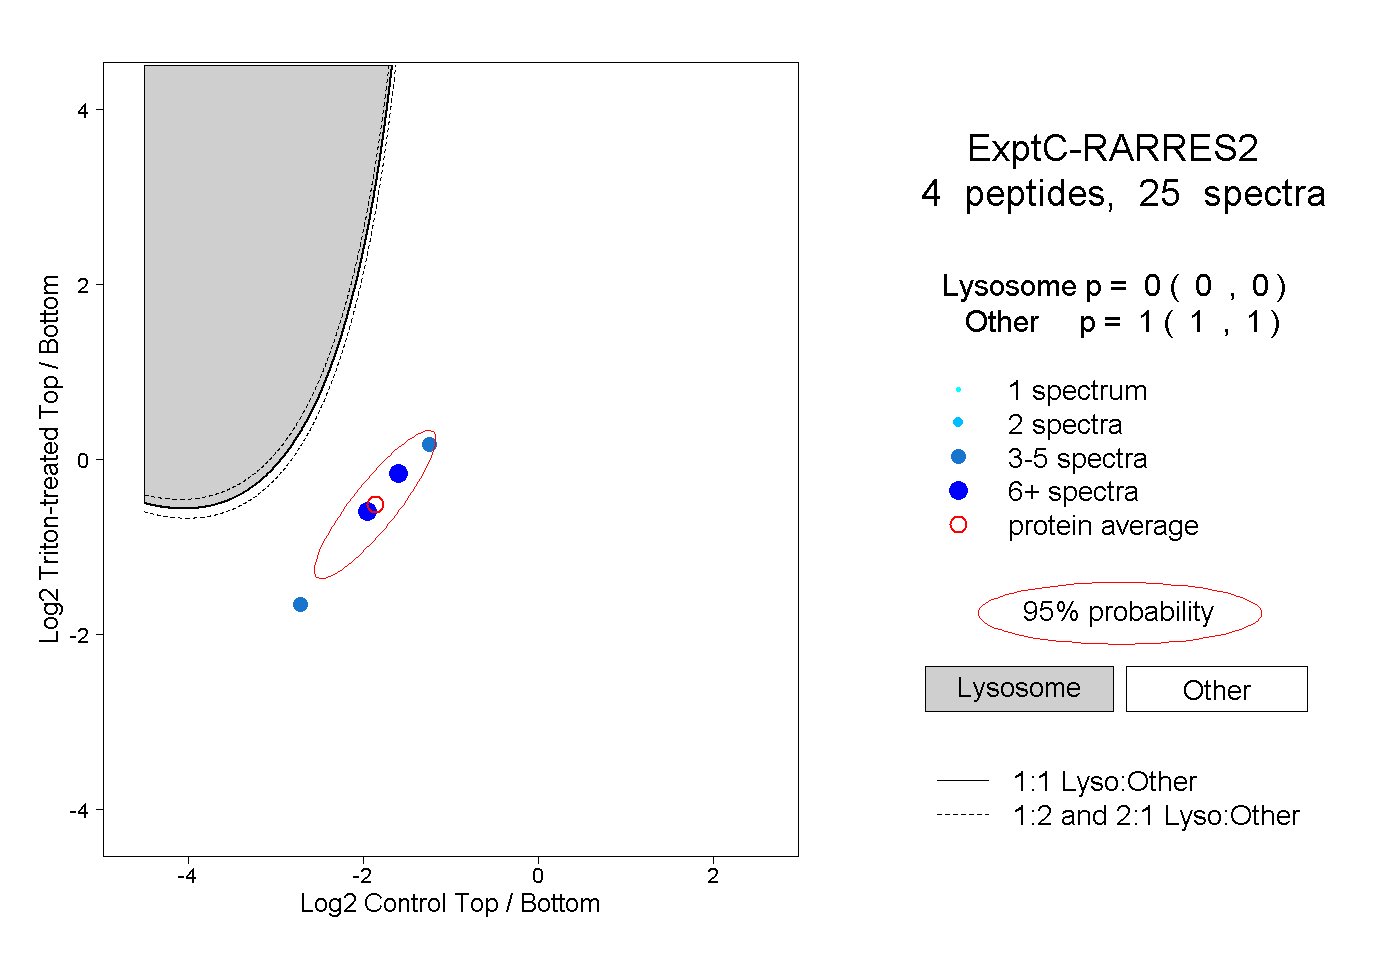
0.000 | 0.000
1.000 | 1.000
2peptides
spectra
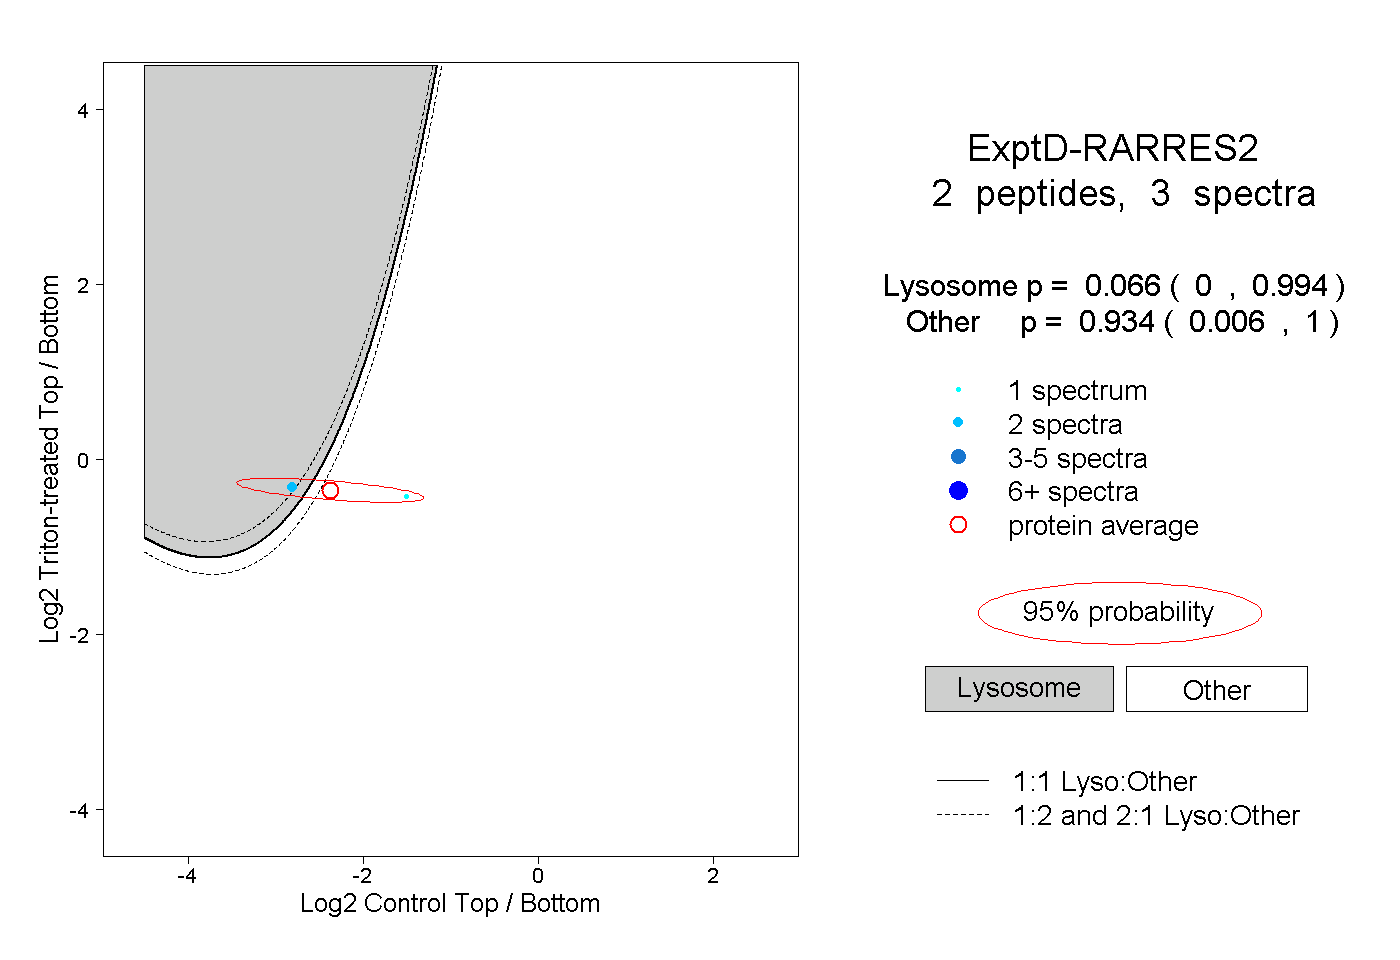
0.000 | 0.994
0.006 | 1.000