 5
5peptides
spectra
0.000 | 0.000
0.220 | 0.266
0.000 | 0.000
0.000 | 0.004
0.086 | 0.137
0.572 | 0.633
0.018 | 0.048
0.000 | 0.000
| Plot | Mito | Lyso | Perox | ER | Golgi | PM | Cytosol | Nucleus | |||||
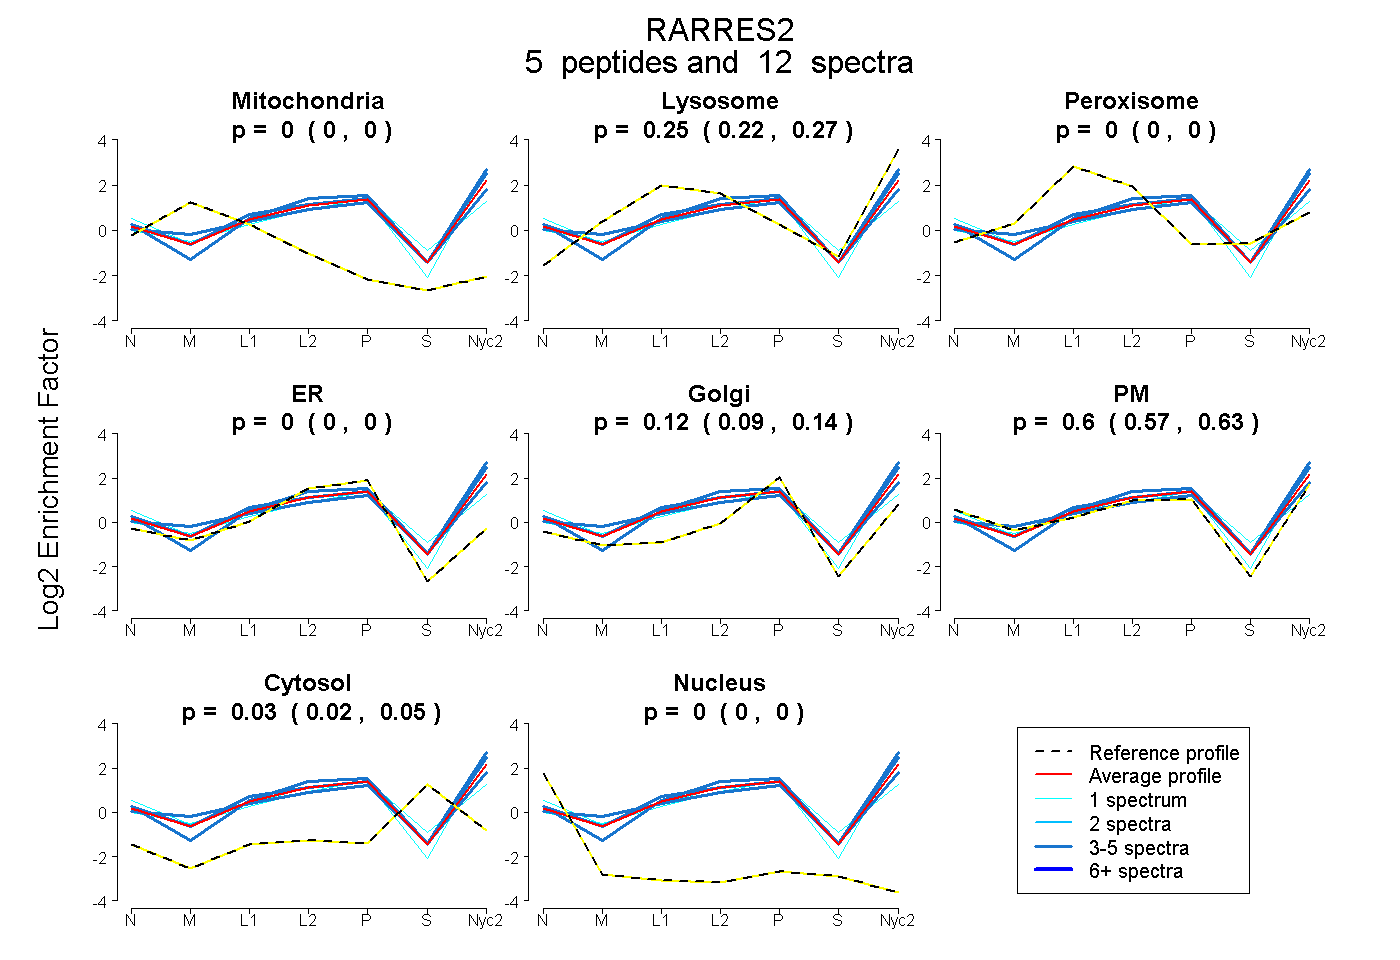
| Expt A |
5 peptides |
12 spectra |
|
0.000 0.000 | 0.000 |
0.246 0.220 | 0.266 |
0.000 0.000 | 0.000 |
0.000 0.000 | 0.004 |
0.116 0.086 | 0.137 |
0.604 0.572 | 0.633 |
0.034 0.018 | 0.048 |
0.000 0.000 | 0.000 |
| 1 spectrum, GLQVALEEFHR | 0.000 | 0.158 | 0.000 | 0.000 | 0.000 | 0.842 | 0.000 | 0.000 | ||
| 3 spectra, IAQAGEDSR | 0.000 | 0.279 | 0.000 | 0.000 | 0.120 | 0.595 | 0.006 | 0.000 | ||
| 4 spectra, MVHCPILK | 0.000 | 0.209 | 0.066 | 0.000 | 0.196 | 0.488 | 0.041 | 0.000 | ||
| 3 spectra, LQQTSCLK | 0.000 | 0.289 | 0.000 | 0.000 | 0.067 | 0.636 | 0.009 | 0.000 | ||
| 1 spectrum, CLACIK | 0.000 | 0.097 | 0.197 | 0.002 | 0.367 | 0.262 | 0.075 | 0.000 |
| Plot | Mito | Lyso or Perox | ER | Golgi | PM | Cytosol | Nucleus | ||||||
| Expt B |
2 peptides |
5 spectra |
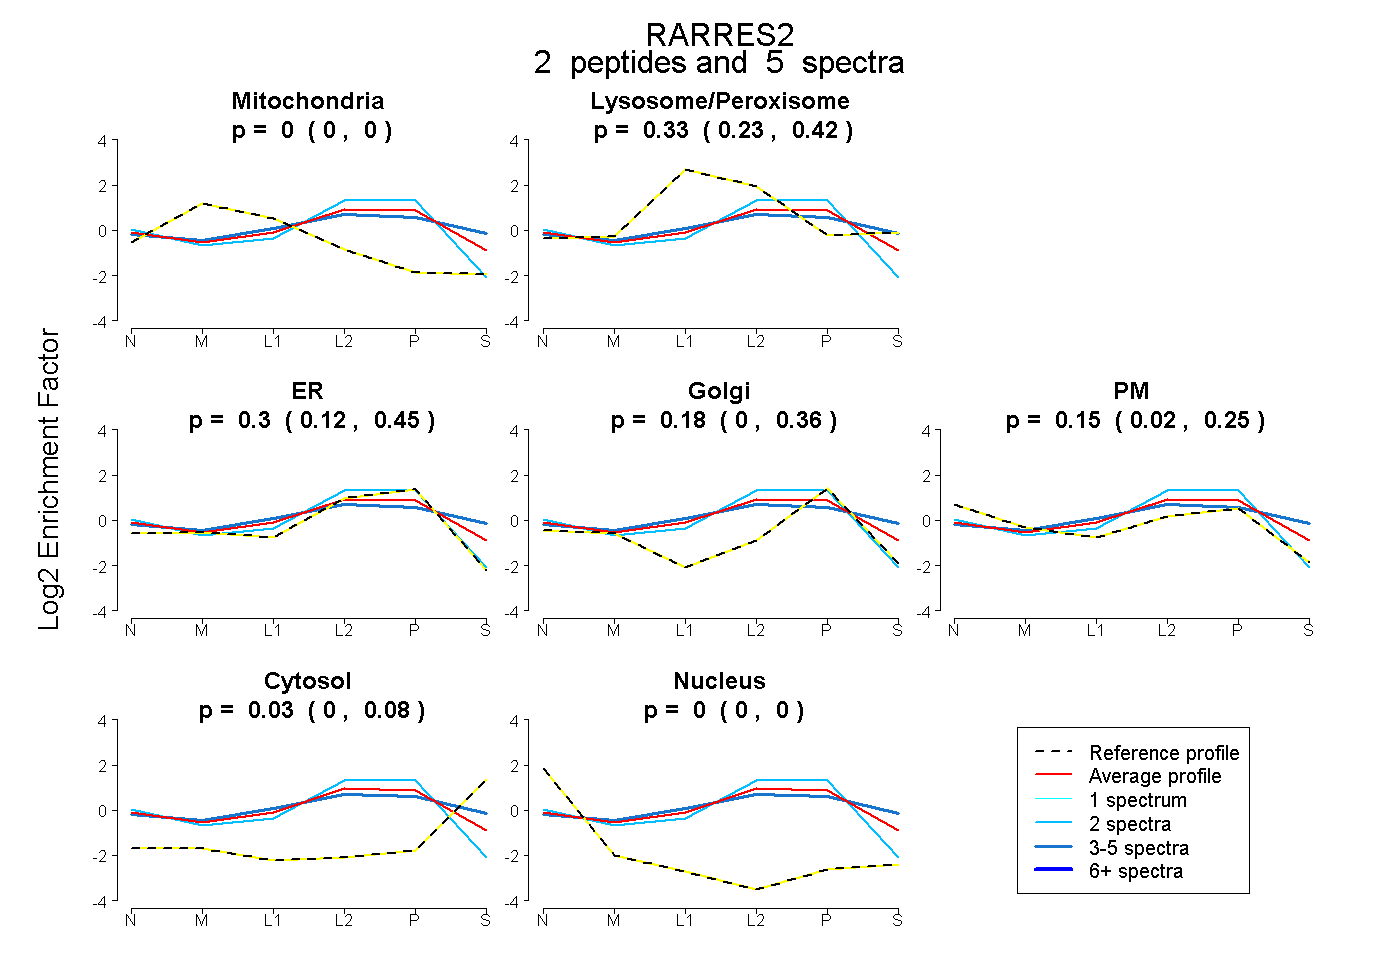 |
0.000 0.000 | 0.000 |
0.330 0.229 | 0.420 |
0.302 0.118 | 0.448 |
0.183 0.000 | 0.361 |
0.151 0.016 | 0.248 |
0.034 0.000 | 0.077 |
0.000 0.000 | 0.000 |
|||
| Plot | Lyso | Other | |||||||||||
| Expt C |
4 peptides |
25 spectra |
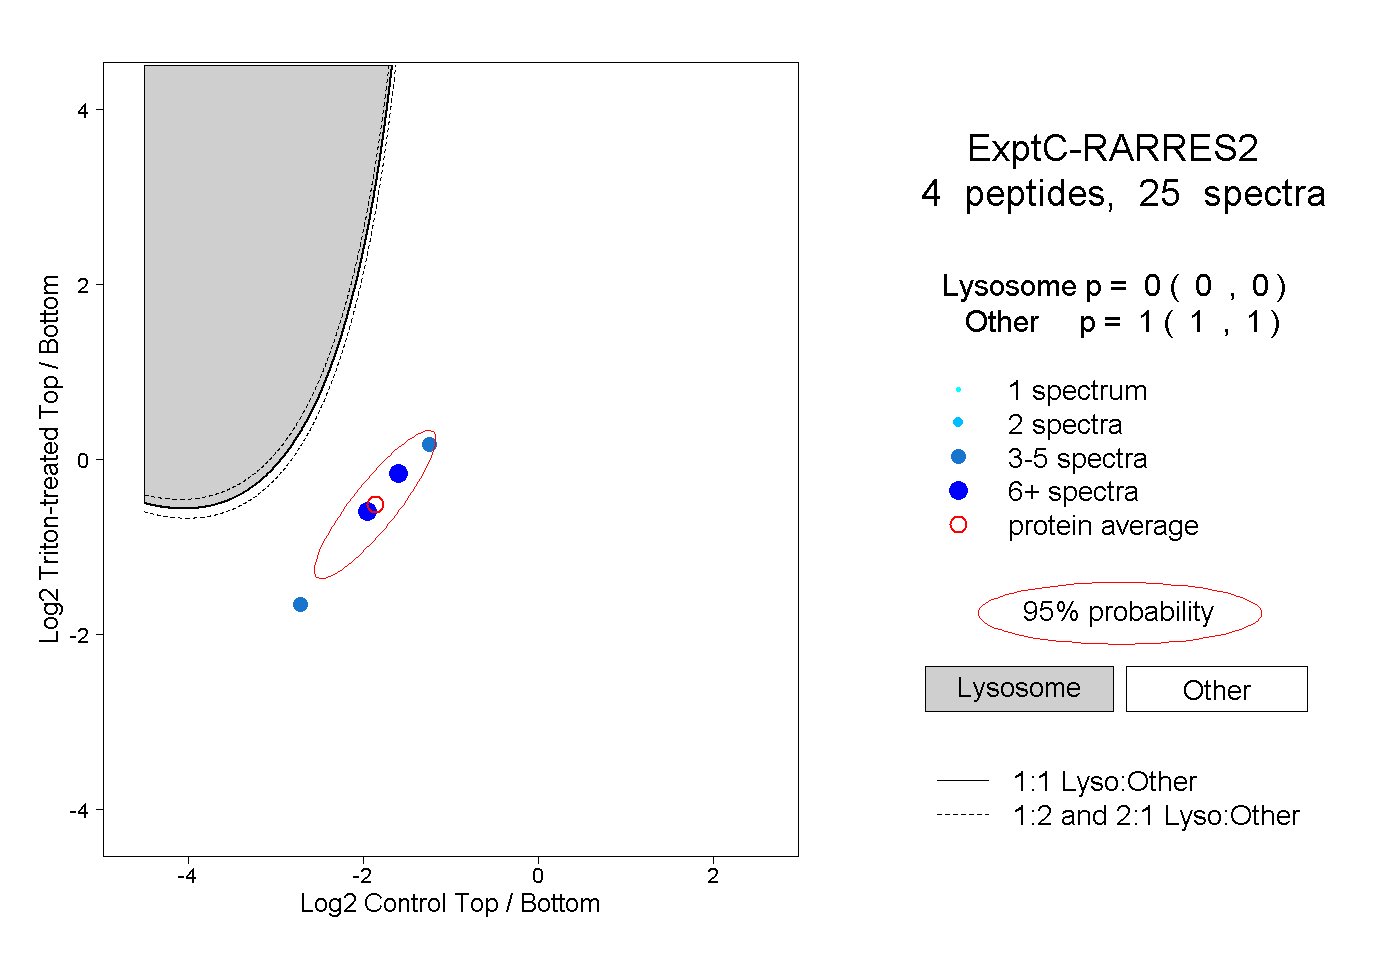 |
0.000 0.000 | 0.000 |
1.000 1.000 | 1.000 |
||||||||
| Plot | Lyso | Other | |||||||||||
| Expt D |
2 peptides |
3 spectra |
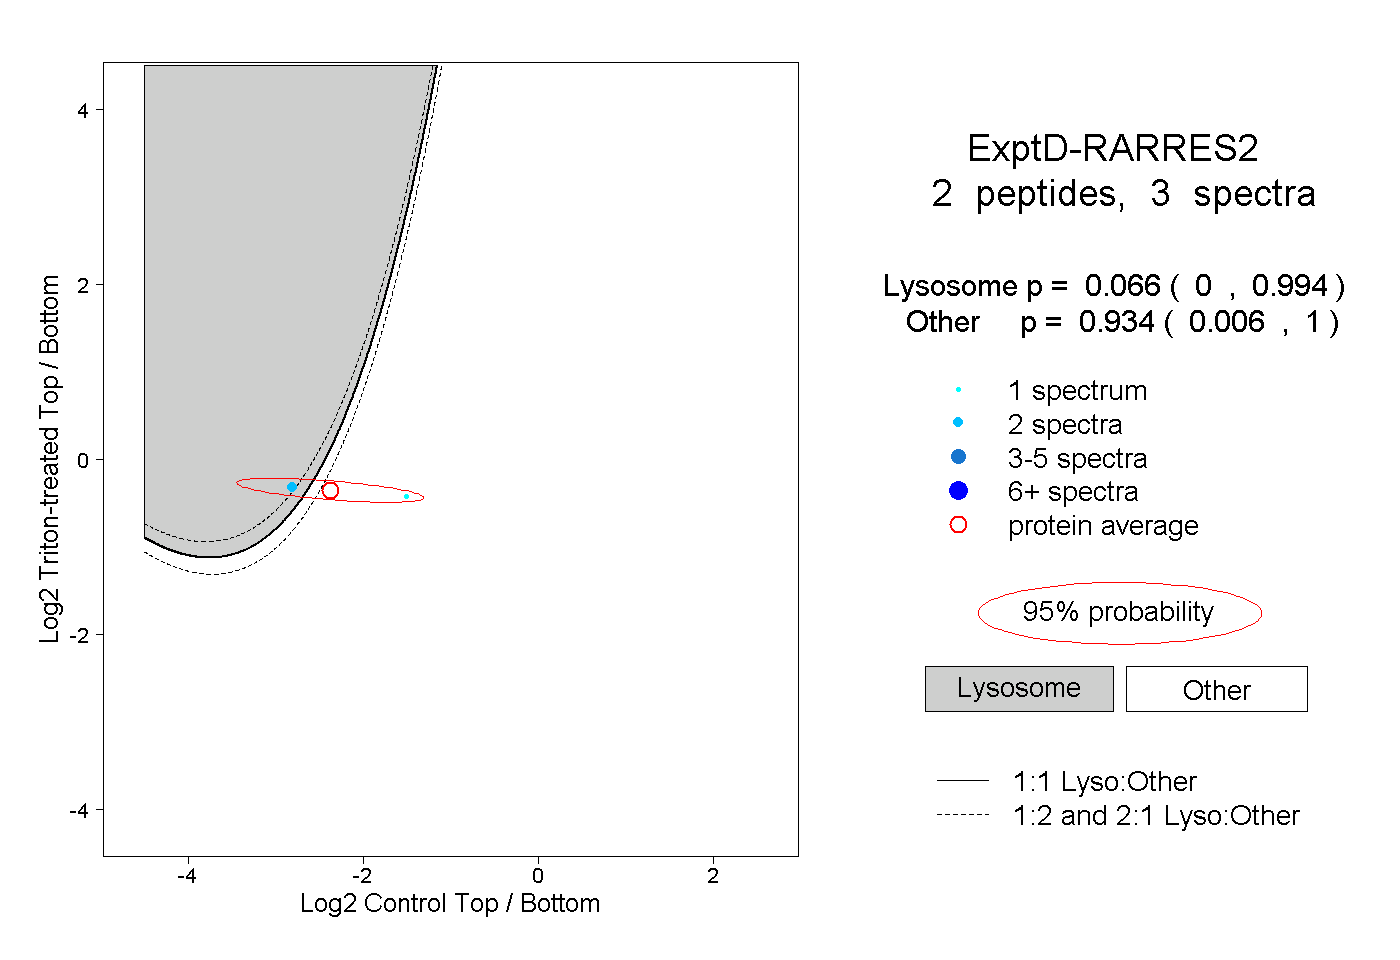 |
0.066 0.000 | 0.994 |
0.934 0.006 | 1.000 |