 6
6peptides
spectra
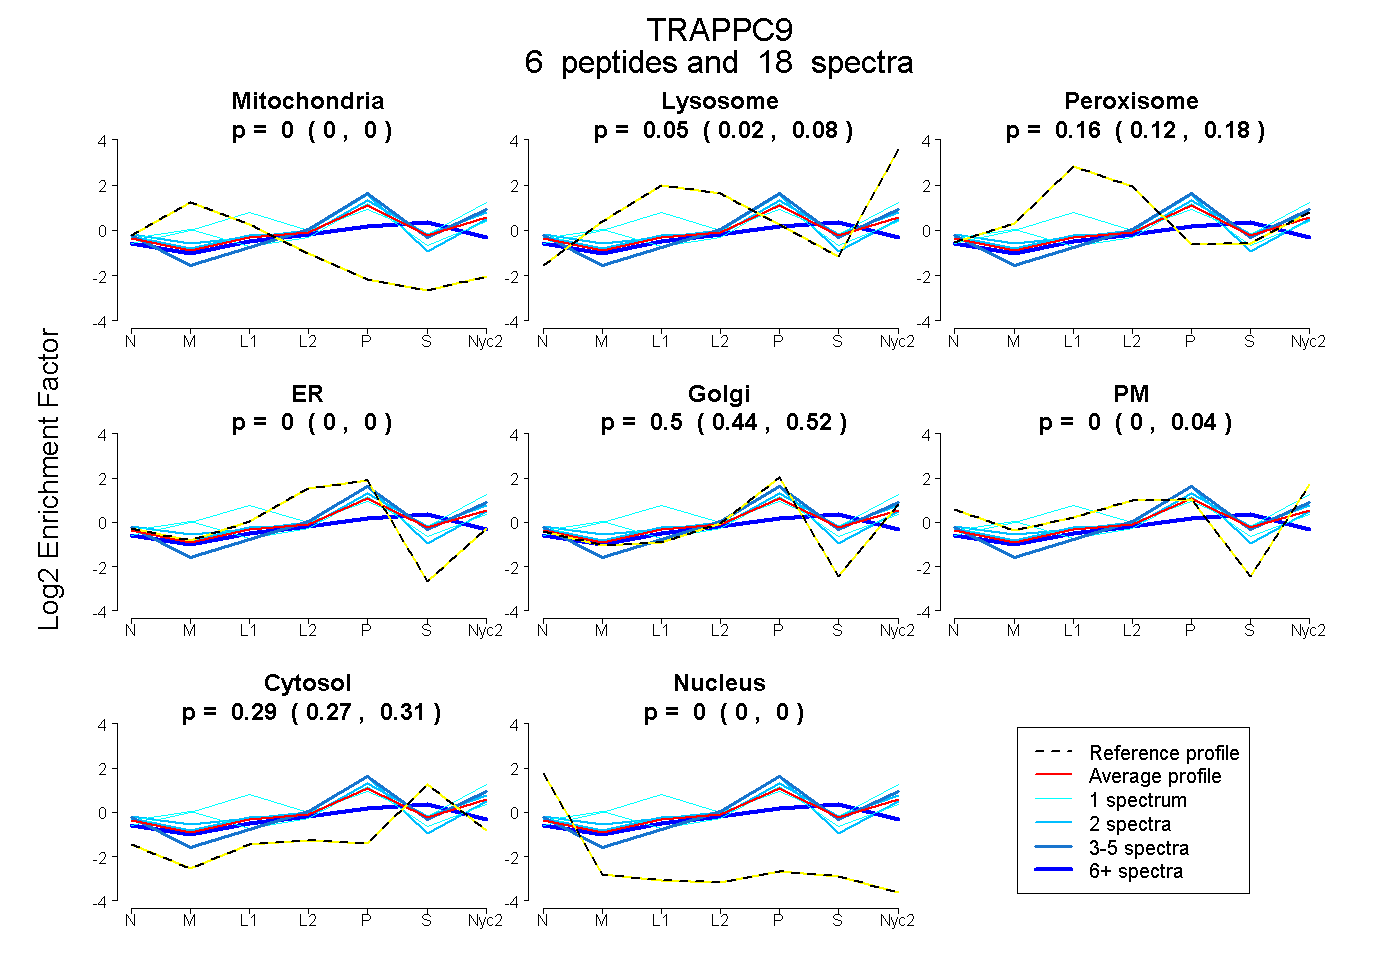
0.000 | 0.000
0.017 | 0.080
0.119 | 0.184
0.000 | 0.000
0.442 | 0.520
0.000 | 0.039
0.272 | 0.311
0.000 | 0.000
2peptides
spectra
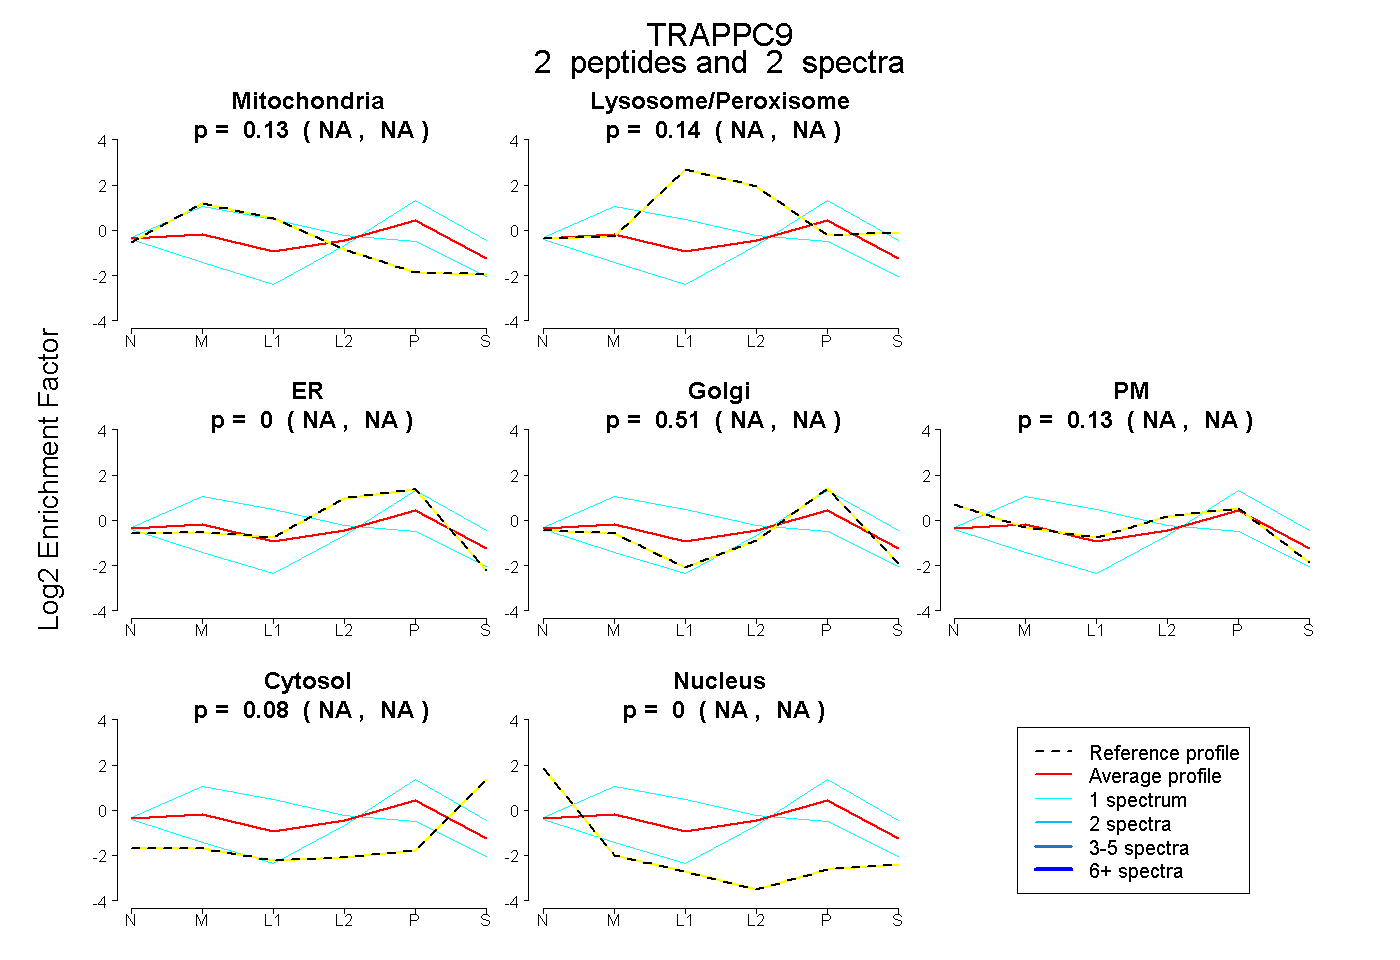
NA | NA
NA | NA
NA | NA
NA | NA
NA | NA
NA | NA
NA | NA
8peptides
spectra
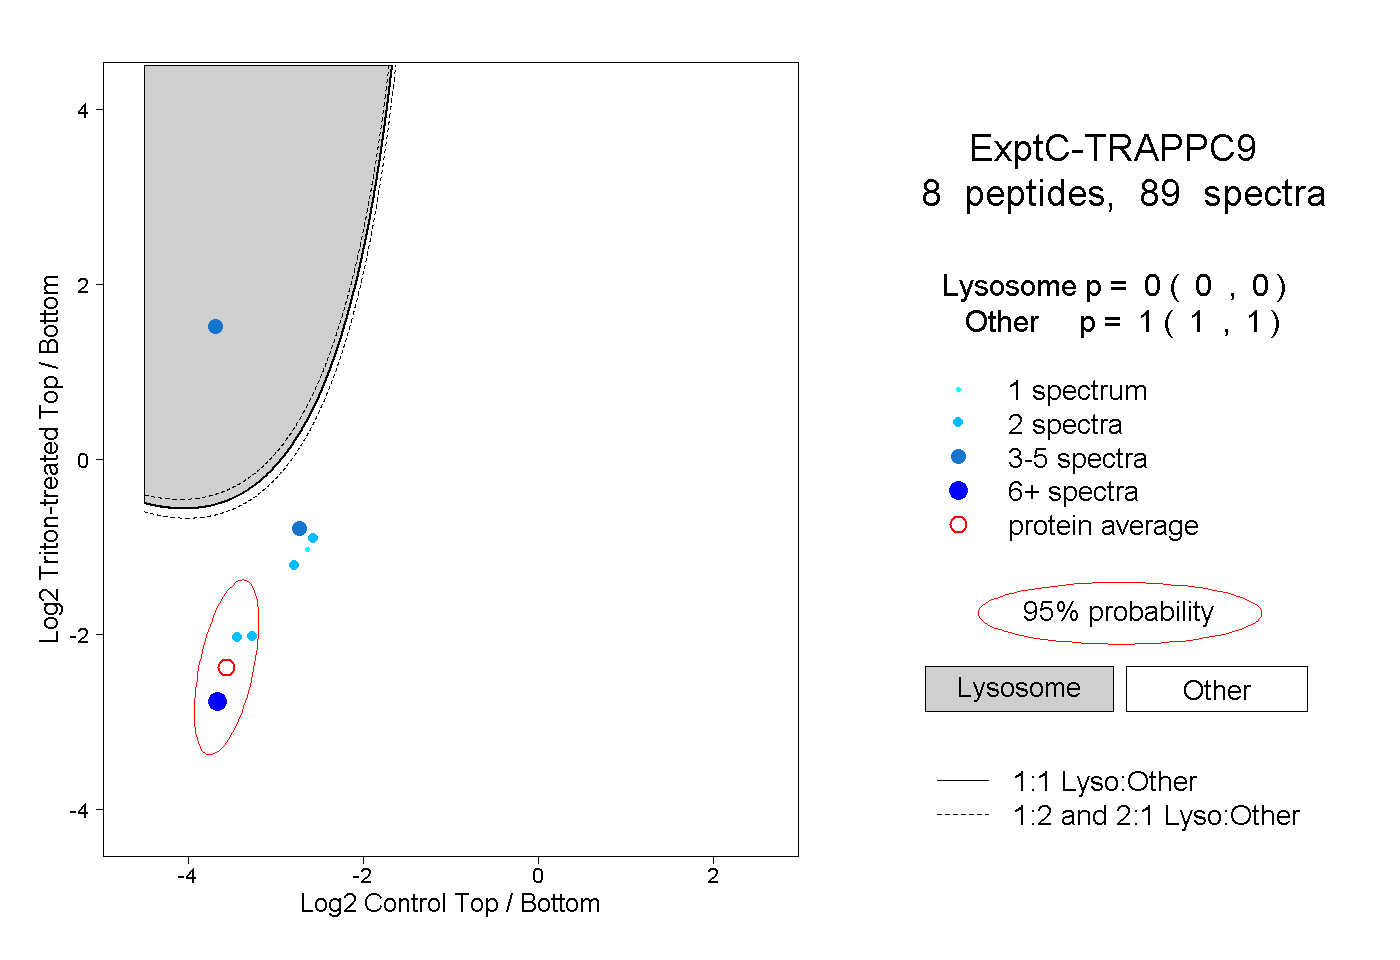
0.000 | 0.000
1.000 | 1.000
2peptides
spectra
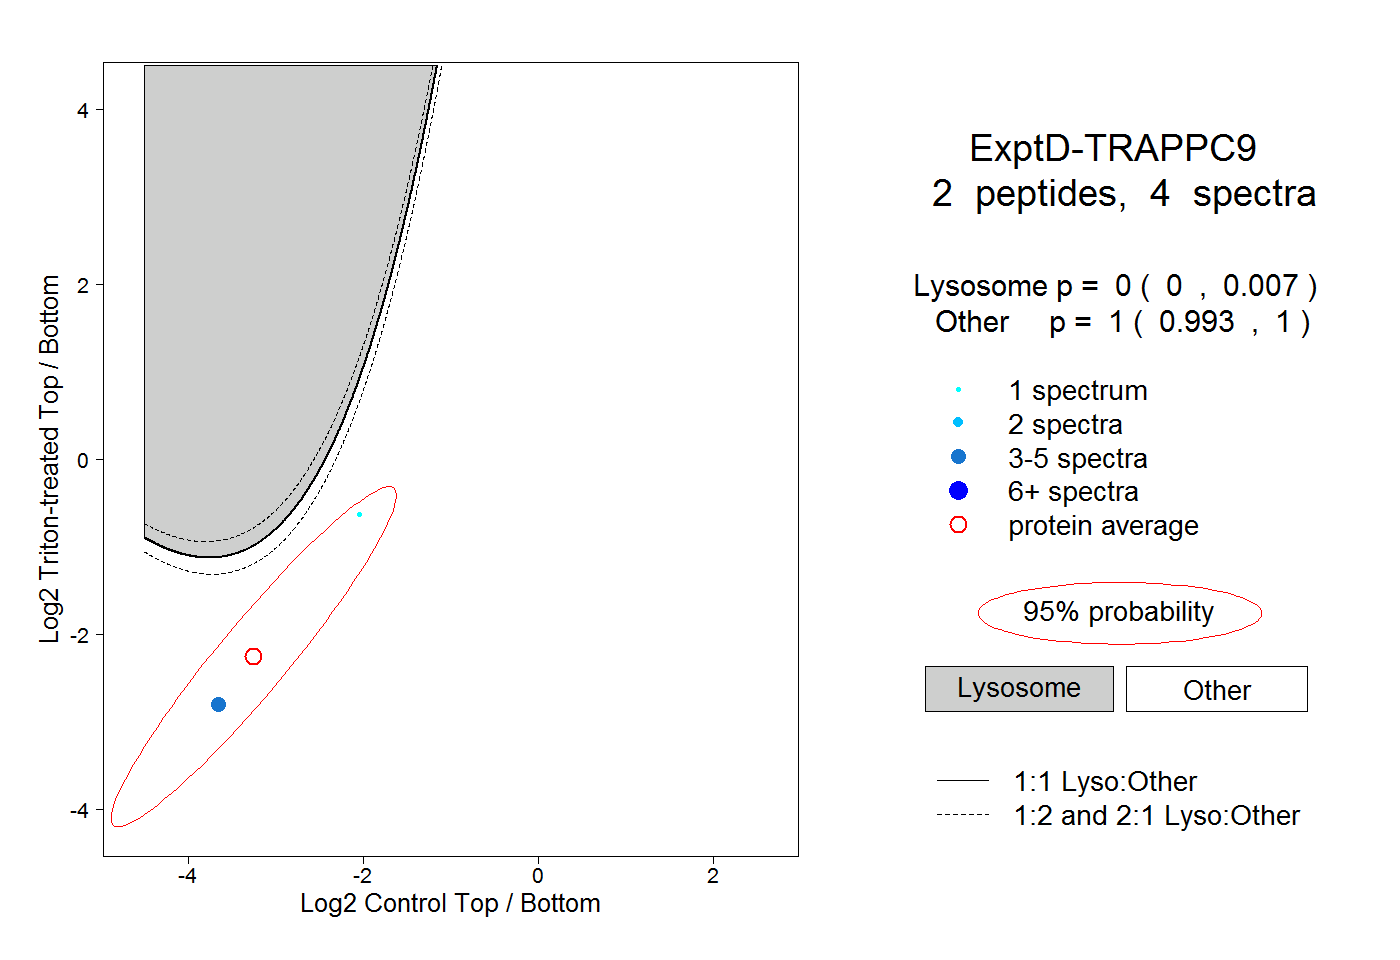
0.000 | 0.007
0.993 | 1.000