 6
6peptides
spectra
0.000 | 0.000
0.017 | 0.080
0.119 | 0.184
0.000 | 0.000
0.442 | 0.520
0.000 | 0.039
0.272 | 0.311
0.000 | 0.000
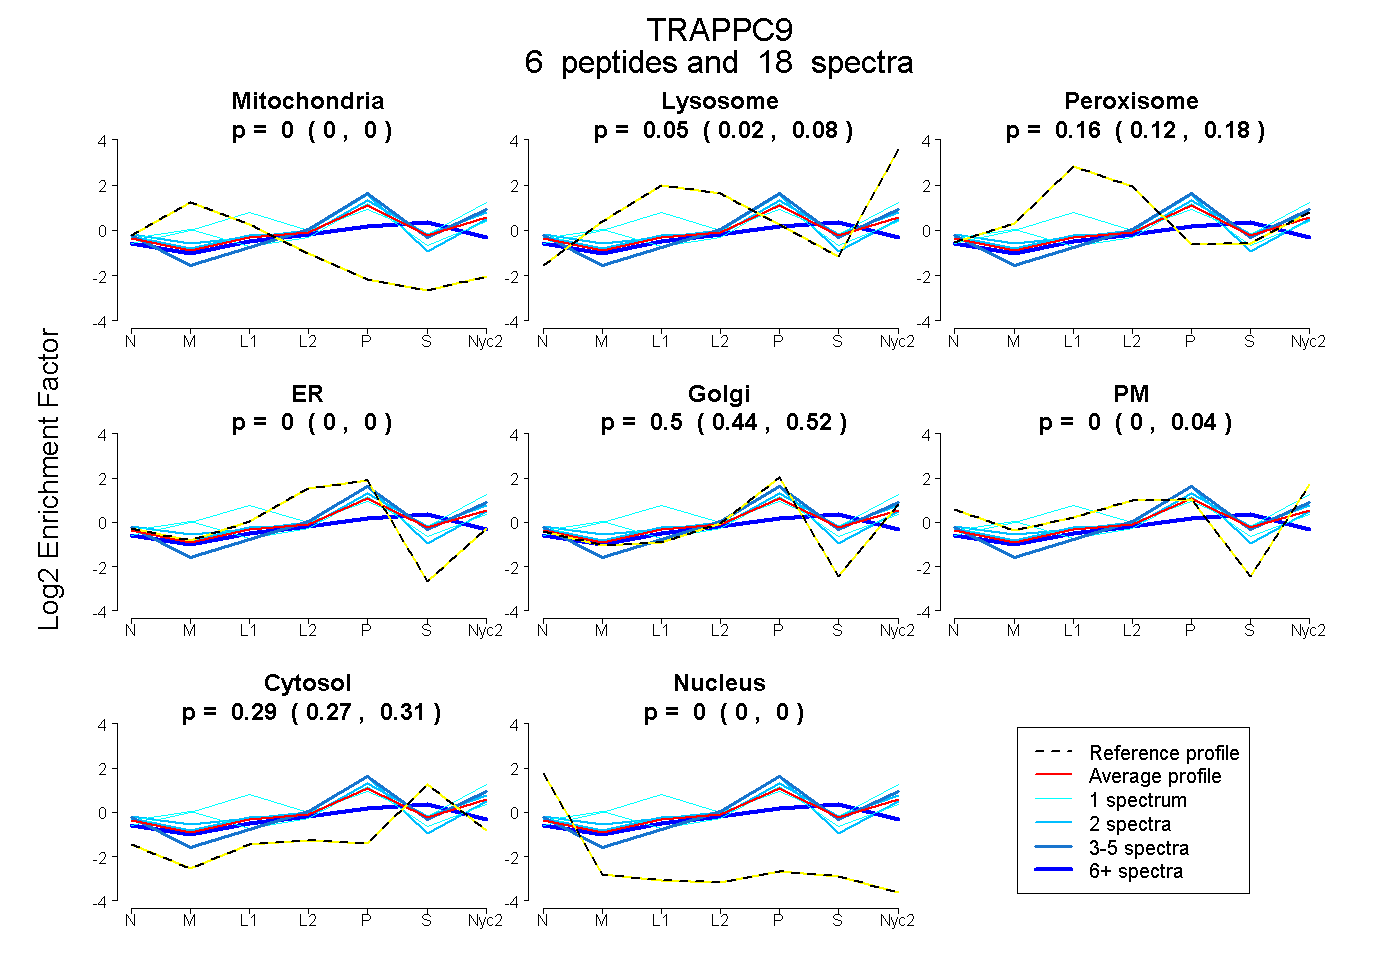
| Plot | Mito | Lyso | Perox | ER | Golgi | PM | Cytosol | Nucleus | |||||
| Expt A |
6 peptides |
18 spectra |
|
0.000 0.000 | 0.000 |
0.051 0.017 | 0.080 |
0.159 0.119 | 0.184 |
0.000 0.000 | 0.000 |
0.497 0.442 | 0.520 |
0.000 0.000 | 0.039 |
0.292 0.272 | 0.311 |
0.000 0.000 | 0.000 |
| 8 spectra, LLGLK | 0.000 | 0.000 | 0.200 | 0.083 | 0.210 | 0.000 | 0.507 | 0.000 | ||
| 2 spectra, EIYGSTLYDSR | 0.000 | 0.095 | 0.126 | 0.000 | 0.506 | 0.007 | 0.266 | 0.000 | ||
| 1 spectrum, MGNPALSVR | 0.000 | 0.259 | 0.235 | 0.000 | 0.314 | 0.000 | 0.192 | 0.000 | ||
| 2 spectra, GHFANLK | 0.000 | 0.000 | 0.186 | 0.000 | 0.681 | 0.000 | 0.133 | 0.000 | ||
| 4 spectra, VSTLPATSTR | 0.000 | 0.090 | 0.000 | 0.000 | 0.568 | 0.056 | 0.286 | 0.000 | ||
| 1 spectrum, LLHELVYASR | 0.084 | 0.058 | 0.085 | 0.000 | 0.575 | 0.000 | 0.198 | 0.000 |
| Plot | Mito | Lyso or Perox | ER | Golgi | PM | Cytosol | Nucleus | ||||||
| Expt B |
2 peptides |
2 spectra |
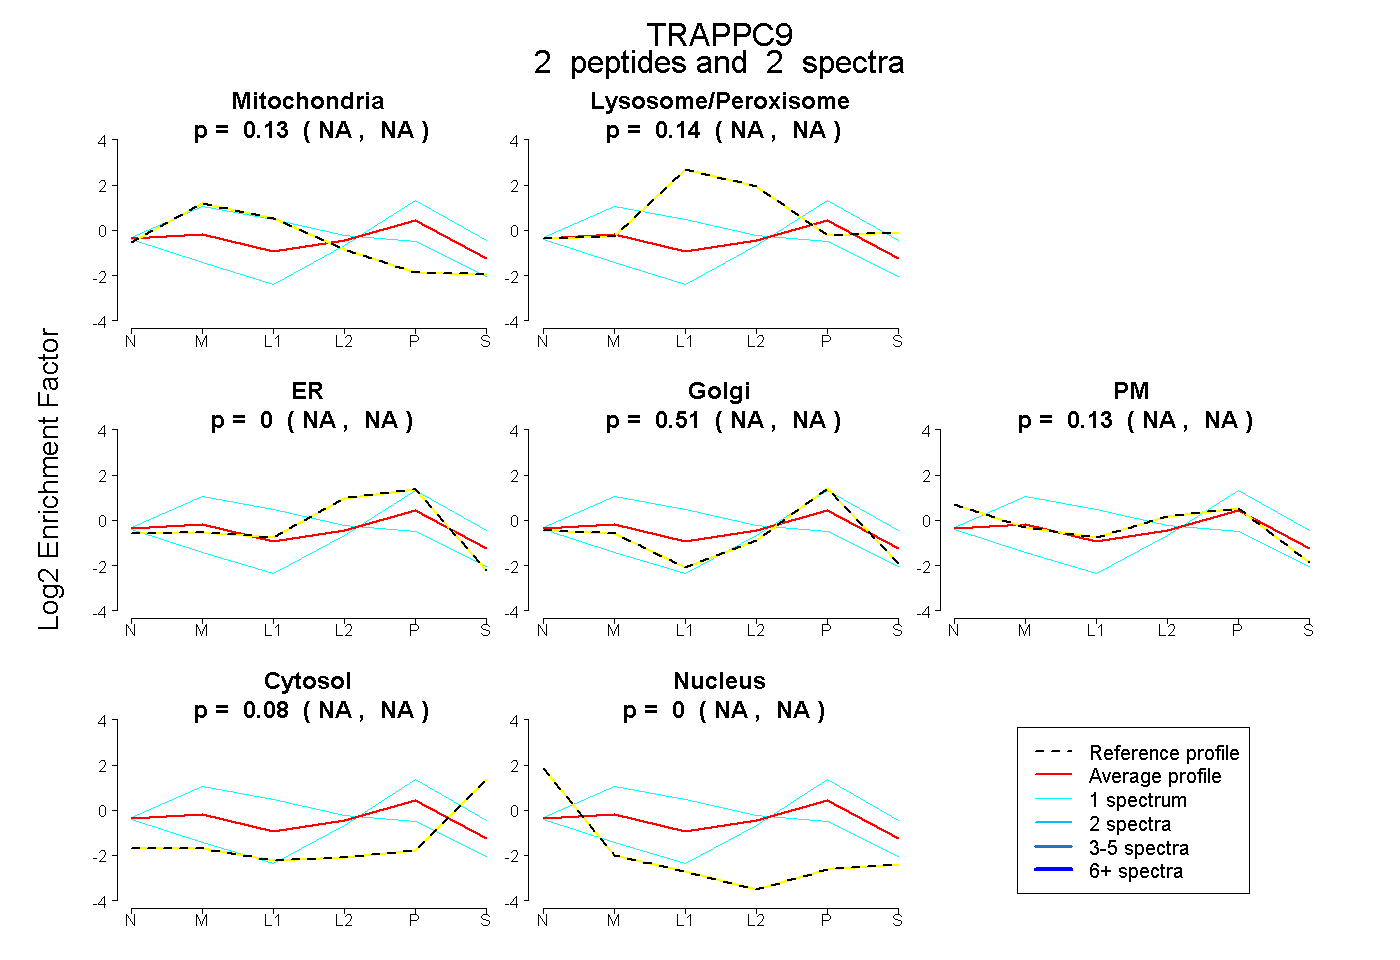 |
0.133 NA | NA |
0.140 NA | NA |
0.000 NA | NA |
0.513 NA | NA |
0.133 NA | NA |
0.081 NA | NA |
0.000 NA | NA |
|||
| Plot | Lyso | Other | |||||||||||
| Expt C |
8 peptides |
89 spectra |
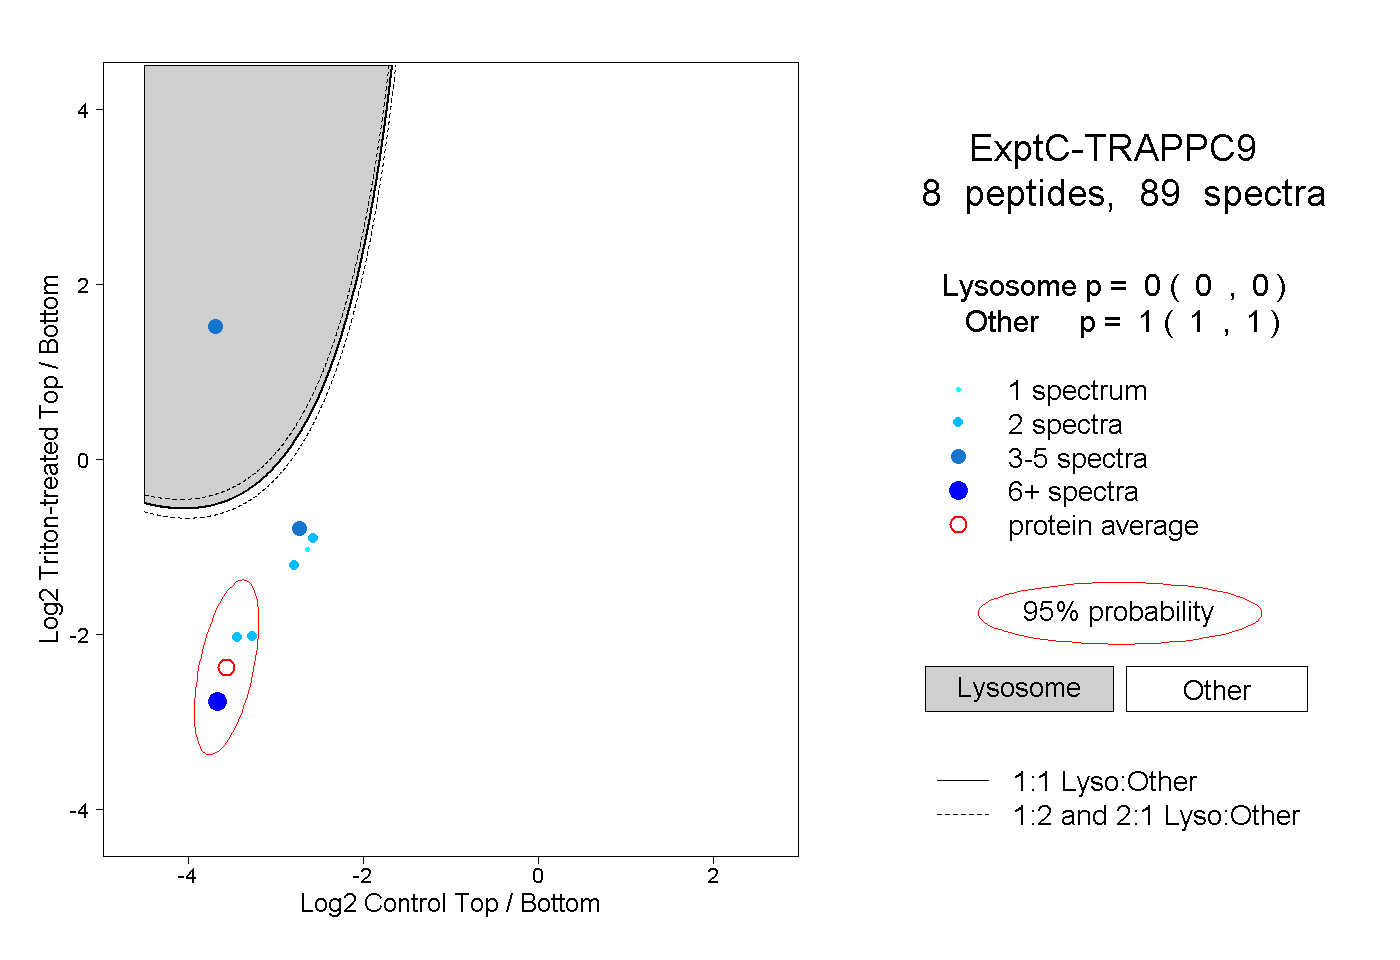 |
0.000 0.000 | 0.000 |
1.000 1.000 | 1.000 |
||||||||
| Plot | Lyso | Other | |||||||||||
| Expt D |
2 peptides |
4 spectra |
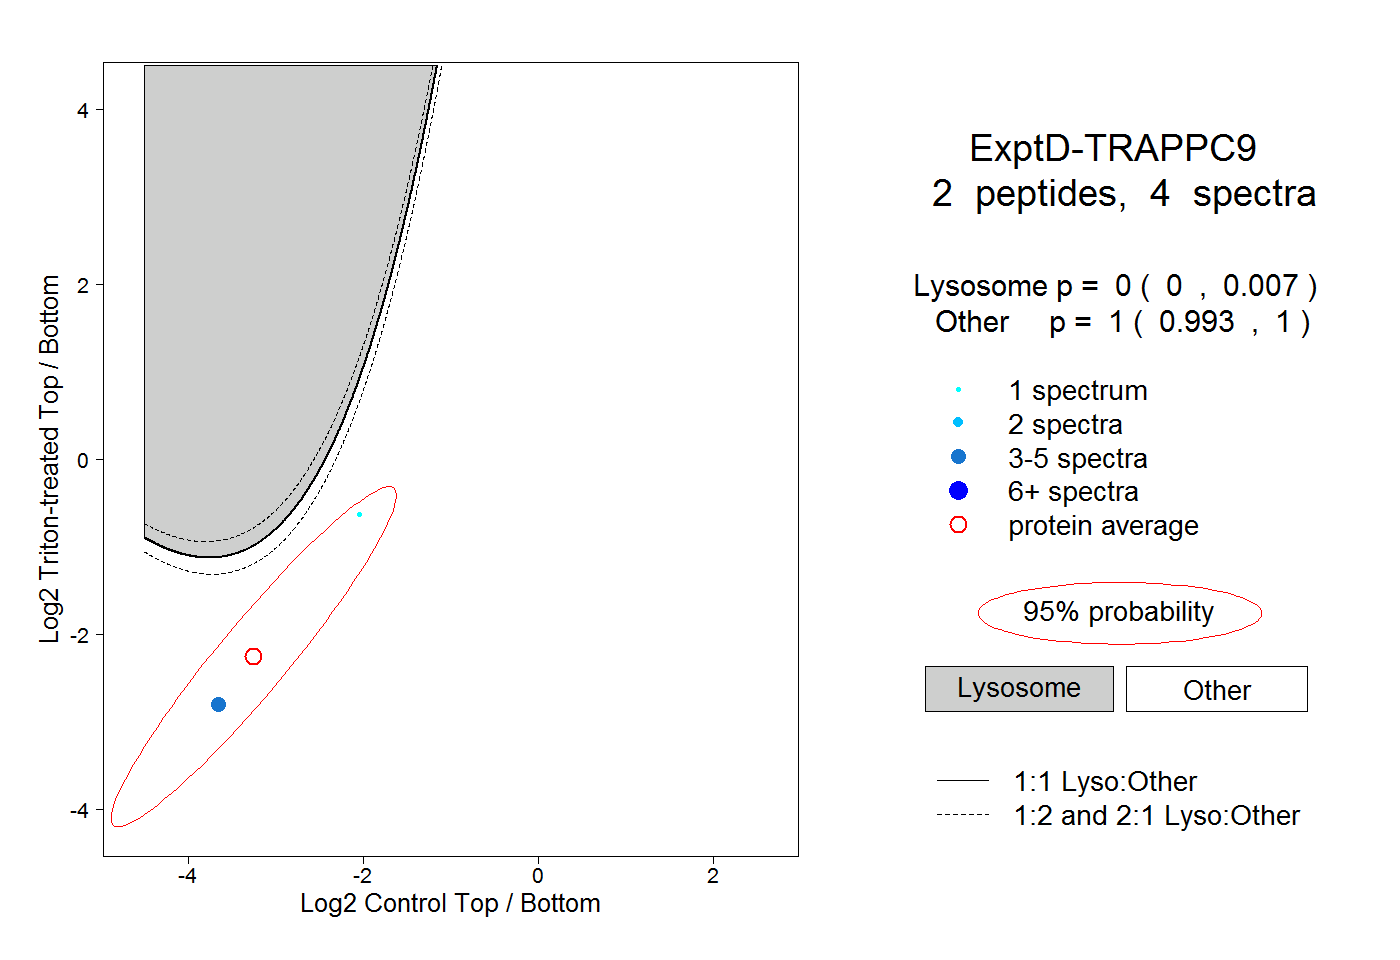 |
0.000 0.000 | 0.007 |
1.000 0.993 | 1.000 |