 16
16peptides
spectra
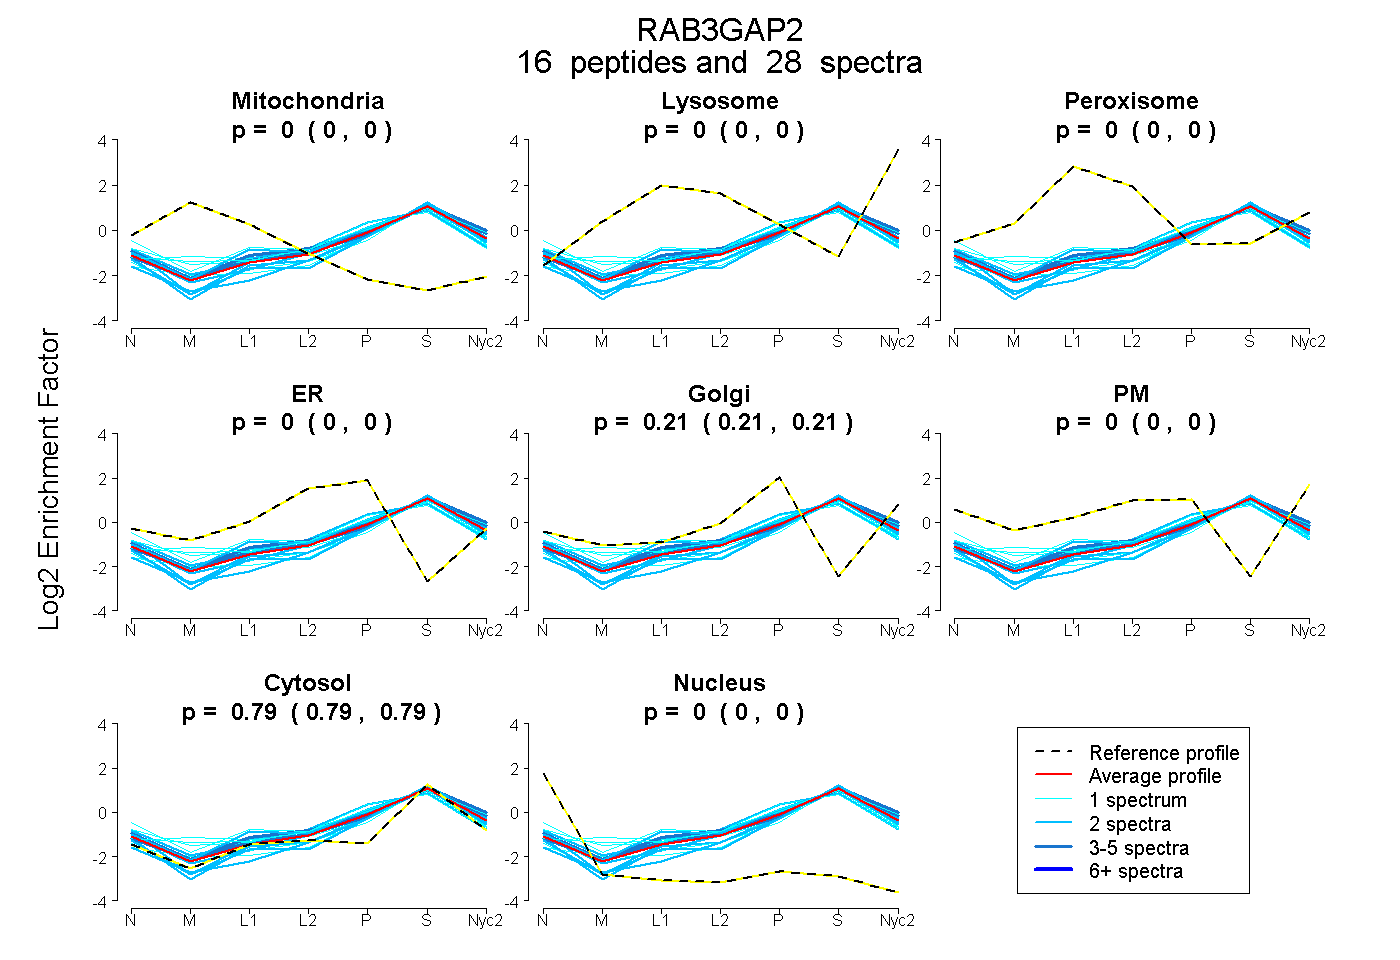
0.000 | 0.000
0.000 | 0.000
0.000 | 0.000
0.000 | 0.000
0.207 | 0.213
0.000 | 0.000
0.786 | 0.793
0.000 | 0.000
3peptides
spectra
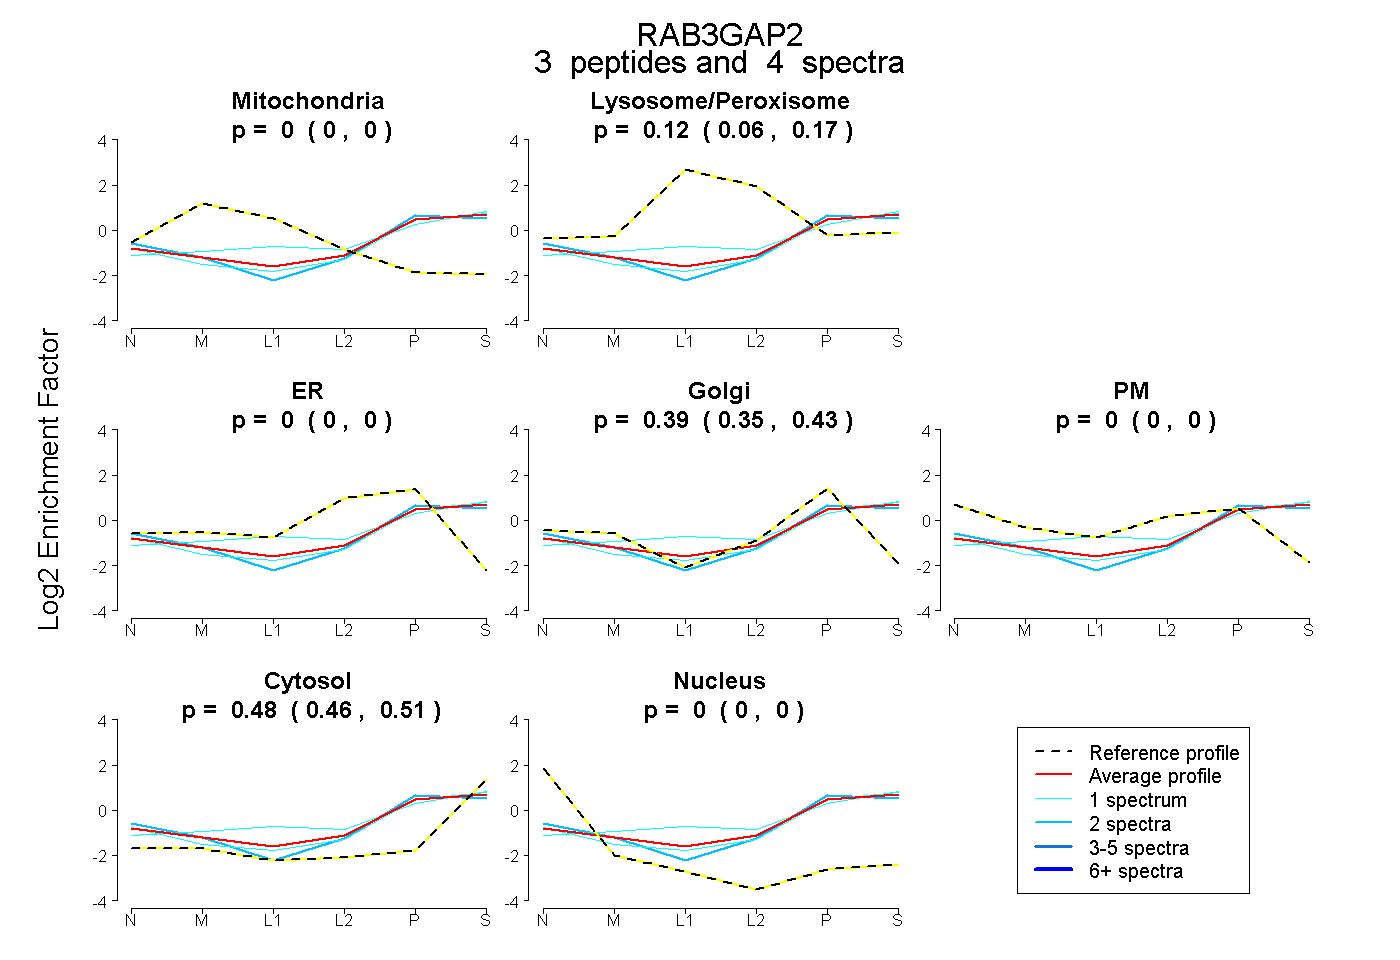
0.000 | 0.000
0.062 | 0.169
0.000 | 0.000
0.351 | 0.432
0.000 | 0.000
0.456 | 0.507
0.000 | 0.000
11peptides
spectra
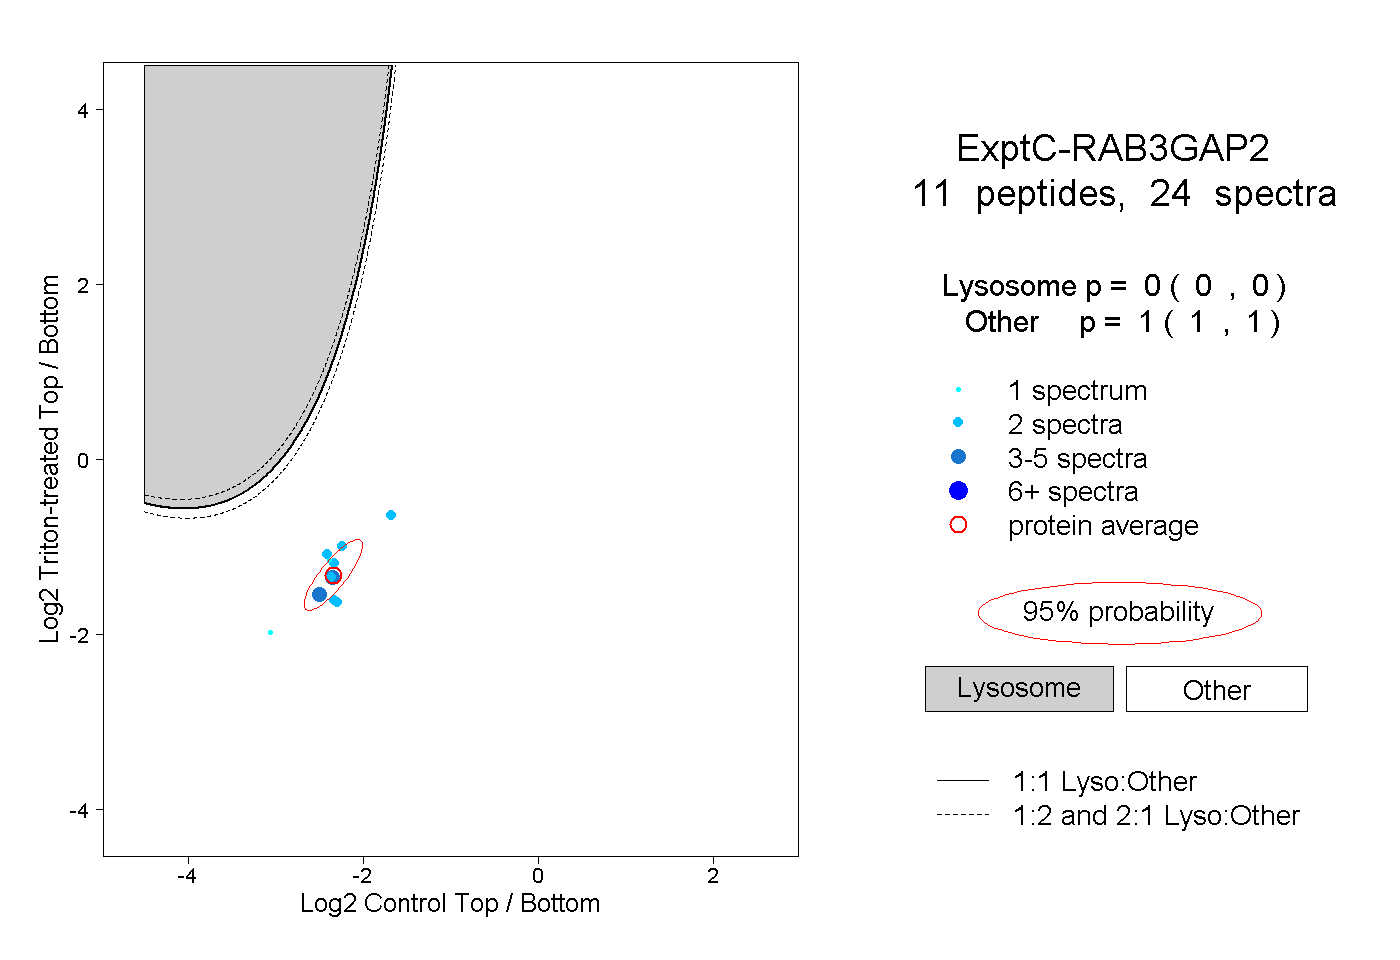
0.000 | 0.000
1.000 | 1.000